RJO FuturesCast

January 10, 2020 | Volume 14, Issue 2

The Markets

Metals - Feb Gold Could Lose Steam

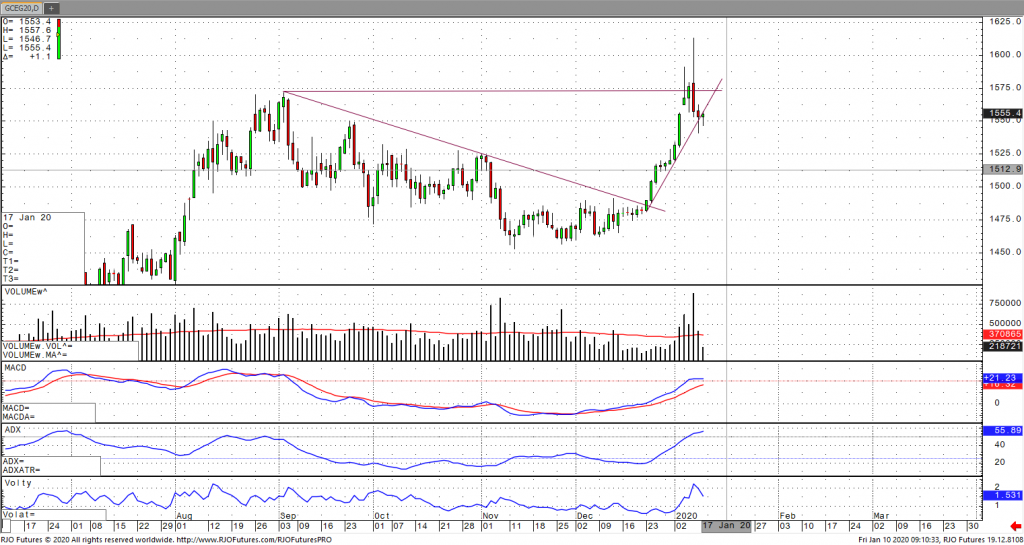
The markets always seem to humble even the best of traders at one point or another, with this week being no exception. The U.S. equity markets along with safe havens such as gold and platinum have seen massive intraday swings from the Iran missile attack. Let’s look at where gold prices should go following the 7-year high that was just made at $1613. First and foremost, it was too far too fast in my opinion. Had the tweet from President Trump now been sent out late the same night as the attack, it’s likely we could have seen push well above 1650 that next morning. Gold has made these moves before, but it can be short lived.  Middle east blips can be excellent day trades, but these events historically do not push markets such as gold higher longer than a few weeks.

Longer term support for gold above $1450-1500 could be attributed to central bank buying worldwide is at the highest levels since 1971, with 650 tons of gold purchased in 2018 alone. Banks in countries such as Russia, Turkey, and China are all buying heavily in the physical realm. Every country has their own reason for this, with Russia doing it to break away from the U.S. dollar specifically as an example. Here are a few ways to watch gold, with the specifics found by contacting me directly. Look at the options for a good plan now that volatility premium has picked up significantly. There are calculated risk plays that can be made involving a combination of long and short options in different months. There is also a pure directional play involving futures with options as a hedge against the futures. Gold seems a bit overvalued even at 1560 in my opinion and would be a buyer at levels that are closer to 1525. 

Metals - Silver Slid and Now Recovers

Mar ’20 Silver recovers today after a harsh sell-off in precious metals following the flare up and simmer down of tensions between U.S. and Iran. Looking at the charts, silver has is trading about where it was prior to all the significant volatility sparked by geopolitical events. Momentum is still in favor of bulls and It seems silver is supported strongly around 17’900. Overall, I think 2020 will be a good year for the precious metals as the U.S. presidential election is likely to be an ugly affair and create volatility favoring safe haven instruments as investors may feel inclined to step out of equities until it’s clear whether or not we will have a business friendly POTUS.   

If you have any questions or would like to discuss the markets further, please feel free to contact me at 800-367-7290 or etesfaye@rjofutures.com.
Energy - Oil Eases After De-Escalation in Tension

Oil sank the most in three months after rising nearly 5%, extracting most of the risk premium that had been built into the market following the killing of the top Iranian general, Qassim Suleimani. Oil reversed after the Islamic Revolutionary Guard Corps claimed responsibility for the missile strikes in Iraq earlier in the week with the administration stating that no one had been killed and that Iran was appearing to ‘stand down.’ In addition, a rather substantive build in inventories further weighed on prices. However, with the prospect of de-escalation and no imminent threat of an impact on oil supply look for oil prices to stabilize, which may further be buoyed by improved demand sentiment. The market is signaling immediate term oversold within its bullish trend with today’s range seen between 58.97 – 64.10.

If you have any questions or would like to discuss the markets further, please feel free to contact me at 800-438-4805 or aturro@rjofutures.com.
Softs - Will Sugar Prices Keep Climbing?

Mar ’20 sugar futures are under pressure this morning like many markets with a tense global atmosphere but remain in a strong upward channel. The main fundamental story of a sizable global production deficit in sugar is still very much in play and continues to support the multi-month rise in sugar prices we have seen. At this point we are likely to see volatility presented by outside market influences, namely the impact of potential increase of military action in the middle east. It’s possible to we may find some bulls take their profits and step to the sidelines. However, do keep in mind that while military conflict with Iran could create a strong risk-off attitude, it could also push energy prices up in a dramatic way, which would have a very bullish influence on sugar due to its use in ethanol production. My analysis of this market is still very bullish, but bulls may need to brace themselves for volatile environment.

Softs - Cotton Looking Rather Bullish

March 20 Cotton hammered down like many markets under the threat of war after the news reported Iranian missiles launched at bases housing US military personnel. After the threat of response was alleviated it seems many bulls instead of stepping to the sidelines saw an opportunity to buy into what they may consider to be an undervalued commodity. Its typically a very strong bullish indicator when charts take out previous lows and close positive, even more bullish when closing at the top of the trading range. Its interesting to note prices are just below a resistance point, if Mar 20 cotton can close above 70.30 I think the next target could easily be 72.00. Its not all bullish though, there are still plenty of cotton ending stocks in the US and globally which may weigh heavily on this economically sensitive market if good news dries up. This market has been in a strong upward trend though and is supported by great demand; if we have a bullish USDA report and/or the Phase 1 deal with China is signed, I think there could be a lot more upside potential.

Agricultural - Bullish Canola Count Intact Above Minimum 851.5

Posted on Oct 14, 2022, 07:42 by Dave Toth

On the heels of mid-Sep-to-early-Oct's steeper, accelerated, 3rd-wave-looking recovery, the past week-and-a-half's boringly lateral chop is first considered a corrective/consolidative event that warns of a continuation of the uptrend that preceded it to new highs above 04-Oct's 891.0 high.  This count remains consistent with our broader base/correction/recovery count introduced in 13-Sep's Technical Blog following that day's bullish divergence in short-term momentum above 07-Sep's 809.5 minor corrective high detailed in the hourly chart below.

The important takeaway from this month's lateral, sleepy price action is the definition of Wed's 851.5 low as the end or lower boundary of a suspected 4th-Wave correction.  A failure below 851.5 will confirm a bearish divergence in daily momentum and defer or threaten a bullish count enough to warrant non-bullish decisions like long-covers.  A failure below 851.5 will not necessarily negate a broader bullish count, but it will threaten it enough to warrant defensive measures as the next pertinent technical levels below 851.5 are 13-Sep's prospective minor 1st-Wave high at 813.8 and obviously 08-Sep's 766.0 low.  And making non-bullish decisions "down there" is sub-optimal to say the least.  Per such, both short- and longer-term commercial traders are advised to pare or neutralize bullish exposure on a failure below 851.5, acknowledging and accepting whipsaw risk- back above 04-Oct's 891.0 high- in exchange for much deeper and sub-optimal nominal risk below 766.0.

On a broader scale, the daily log scale chart above shows the developing potential for a bearish divergence in daily momentum that will be considered confirmed below 851.5.  This chart also shows the past month's recovery thus far stalling in the immediate neighborhood of the (888.0) Fibonacci minimum 38.2% retrace of Apr-Sep's entire 1128 - 766 decline).  COMBINED with a failure below 851.5, traders would then need to be concerned with at least a larger-degree correction pf the past month's rally and possibly a resumption of Apr-Sep's major downtrend.

Until and unless the market fails below 851.5 however, we would remind longer-term players of the key elements on which our bullish count is predicated:

  • a confirmed bullish divergence in WEEKLY momentum (below) amidst
  • an historically low 11% reading in out RJO Bullish Sentiment Index and
  • a textbook complete and major 5-wave Elliott sequence down from 29-Apr's 1128 high to 08-Sep's 766.0 low.

Thus far, the market is only a month into correcting a 4-MONTH, 32% drawdown, so further and possibly protracted gains remain well within the bounds of a major (suspected 2nd-Wave) correction of Apr-Sep's decline within an even more massive PEAK/reversal process from 17-May's 1219 high on an active continuation basis below.

These issues considered, a bullish policy and exposure remain advised with a failure below 851.5 required to defer or threaten this call enough to warrant moving to a neutral/sideline position.  In lieu of such weakness, we anticipate a continuation of the past month's rally to new highs and potentially significant gains above 891.0.

Agricultural - Grain Futures Update w/Stephen Davis - 01/10/2019

Stephen Davis discusses the past week in the grain markets and looks to the week ahead. China will be signing the Phase One Trade Deal on Monday and it will be interesting to see how that will affect the grains.

Agricultural - Live Cattle Demand Slowing

April cattle seems to be in a bit of consolidation right now with yesterday’s sell-off ultimately resulting in an inside day because of the big rally we had on Monday. Demand seems to be slowing with packer margins down substantially over the past few weeks and with the 5 day forecast, weights are looking to be higher than normal due to the dry forecast. Cash cattle in Kansas traded at $124 on light volume, still leaving a large premium to the futures market. Some news that sparked the rally on Monday was cash trading $2 higher along with the news of Australia’s significant drop off of their beef exports because of the drought and wildfires that are going on.

The USDA estimated cattle slaughter came in at 123,000 head yesterday. This brings the total for the week so far to 244,000 head, up from 218,000 last week, and up from 239,000 a year ago. The USDA boxed beef cutout was down 8-cents at mid-session yesterday and closed 9-cents lower at $209.56. This was down from $209.66 the previous week and was the lowest the cutout had been since January 3. The cutout is down from $214.28 a year ago. There was some light trade of cash live cattle trade reported in Kansas yesterday (856 head) at 124, which was at the top end of last week's range. The COT report showed managed money traders were net sellers of 5,222 contracts of cattle for the week ending December 31, reducing their net long to 83,295.

Equity - Stocks Higher Despite Weak Numbers

U.S. stock index futures are trading higher today, this was helped by gains from top technology names including Apple, while traders were closely watching the jobs report for confirmation that the U.S. economy remains healthy. According to data released by the Labor Department this morning, the market for U.S. jobs closed the year on a down note, with payroll and wage growth for December missing expectations. Nonfarm payrolls rose by just 145,000 while the unemployment rate remained steady at 3.5%. Analysists surveyed by Dow Jones had been forecasting a job growth number of 160,000. The jobless rate met expectations for staying at a 50-year low. Adding to the slow payroll growth, average hourly earnings only rose by 2.9%, well below the 3.1% projection. December marked the first time that wage gains were below 3% on a year-over-year basis since July 2018. “After a strong 256,000 gain in payrolls in November, boosted by the return of 40,000 GM workers, some slowdown in the pace of job gains in December was inevitable,” Michael Pearce, senior U.S. economist at Capital Economics, said in a note. Pearce characterized the job growth as “solid” even though it missed estimates and said, “we expect solid gains in payrolls to extend through 2020.”

Support is checking in today at 326500 and 325100, while resistance is showing 328500 and 329000.

If you have any questions or would like to discuss the markets further, please feel free to contact me at 888-861-1656 or jyasak@rjofutures.com.
Economy - S-T Mo Failure Insufficient to End RBOB Correction, But Beware

Posted on Nov 08, 2022, 07:51 by Dave Toth

In Fri's Technical Webcast we identified a minor corrective low at 2.6328 from Thur as a mini risk parameter the market needed to sustain gains above to maintain a more immediate bullish count.  The 240-min chart below shows the market's failure overnight below this level, confirming a bearish divergence in very short-term momentum.  This mo failure defines Fri's 2.8172 high as one of developing importance and a parameter from which very short-term traders can objectively base non-bullish decisions like long-covers.

Given the magnitude of the past three weeks' broader recovery however, this short-term momentum failure is of an insufficient scale to conclude anything more than another correction within this broader recovery from 26-Sep's 2.1877 low.  Indeed, overnights failure below 2.6328 only allows us to conclude the end of the portion of the month-and-a-half rally from 31-Oct's 2.4822 next larger-degree corrective low.  2.4822 is the risk parameter this market still needs to fail below to break the uptrend from 18-Oct's 2.3526 low while this 2.3526 low remains intact as the risk parameter this market needs to fail below to break the month-and-a-half uptrend.  From an intermediate-to-longer-term perspective, this week's setback falls well within the bounds of another correction ahead of further gains.  This is another excellent example of the importance of technical and trading SCALE and understanding and matching directional risk exposure to one's personal risk profile.

The reason overnight's admittedly minor mo failure might have longer-term importance is the 2.8172-area from which it stemmed.  In Fri's Technical Blog we also noted the market's engagement of the 2.8076-to-2.8159-area marked by the 61.8% retrace of Jun0-Sewp's 3.2758 -2.1877 decline and the 1.000 progression of Sep-Oct's initial 2.1877 - 2.6185 (suspected a-Wave) rally from 18-Oct's 2.3526 (suspected b-Wave) low.  We remind longer-term players that because of the unique and compelling confluence of:

  • early-Aug's bearish divergence in WEEKLY momentum amidst
  • historically extreme bullish sentiment/contrary opinion levels in our RJO Bullish Sentiment Index
  • an arguably complete and massive 5-wave Elliott sequence from Mar'20's 0.4605 low to Jun's 4.3260 high (as labeled in the weekly log active-continuation chart below) and
  • the 5-wave impulsive sub-division of Jun-Sep's (suspected initial 1st-Wave) decline

The recovery attempt from 26-Sep's 2.1877 low is arguably only a 3-wave (Wave-2) corrective rebuttal to Jun-Sep's decline within a massive, multi-quarter PEAK/reversal process.  Now granted, due to the magnitude of 2020 -2022's secular bull market, we discussed the prospect for this (2nd-Wave corrective) recovery to be "extensive" in terms of both price and time.  A "more extensive" correction is typified by a retracement of 61.8% or more and spanning weeks or even months following a 3-month decline.  Per such, the (suspected corrective) recovery from 26-Sep's 2.1877 low could easily have further to go, with commensurately larger-degree weakness than that exhibited this week (i.e., a failure below at least 2.4822) required to consider the correction complete.  Indeed, the daily log chart above shows the market thus far respecting former 2.6185-area resistance from 10-Oct as a new support candidate.

These issues considered, very shorter-term traders have been advised to move to a neutral/sideline position following overnight's momentum failure below 2.6328, with a recovery above 2.8172 required to negate this call, reaffirm the recovery and re-expose potentially significant gains thereafter.  For intermediate- and longer-term players, a bullish policy and exposure remain advised with a failure below 2.4822 required to threaten this call enough to warrant neutralizing exposure.  We will be watchful for another bearish divergence in momentum following a recovery attempt that falls short of Fri's 2.8172 high that would be considered the next reinforcing factor to a count calling that 2.8172 high the prospective end to the month-and-a-half 2nd-Wave correction.  In lieu of such, a resumption of the current rally to eventual new highs above 2.8172 should not surprise.

Coming Up Next Week...

View Futures Calendar