Basic technical analysis and trading strategy applicable to these markets
RJO Echo Trading
Attention New or Frustrated Traders:
Do you want to get into futures trading, but don’t have the time or knowledge necessary to do so? RJO Echo Trading is an intuitive way for investors or “echo followers” to automatically match the performance of veteran and accomplished traders. As an “Echo Follower” you will choose from a selection of vetted and experienced “Echo Leaders”, all you have to do is pay a subscription fee and your account will mimic the trades of your chosen “Leader”. Echo Trading eliminates the learning curve needed to trade futures, making it an option for all.
>
The Markets
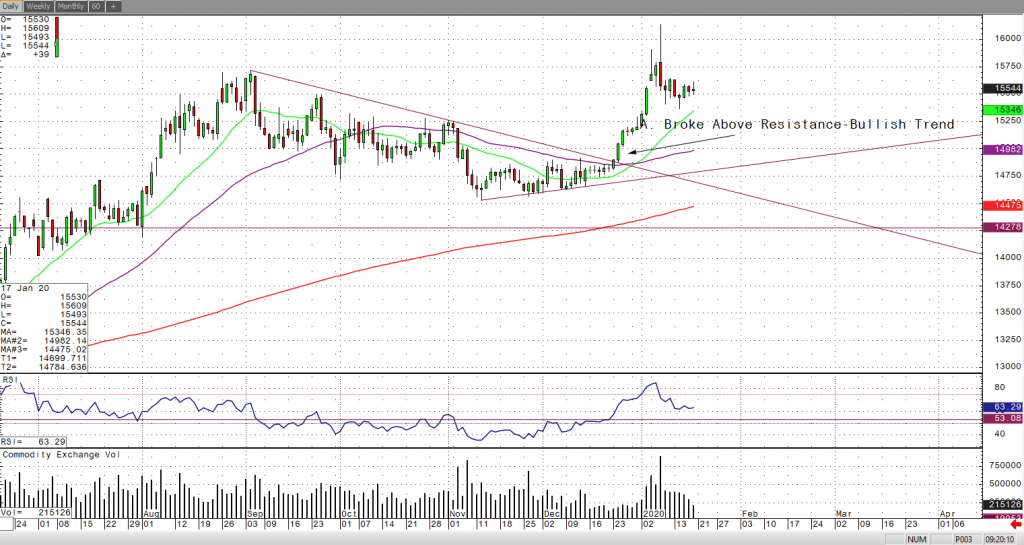
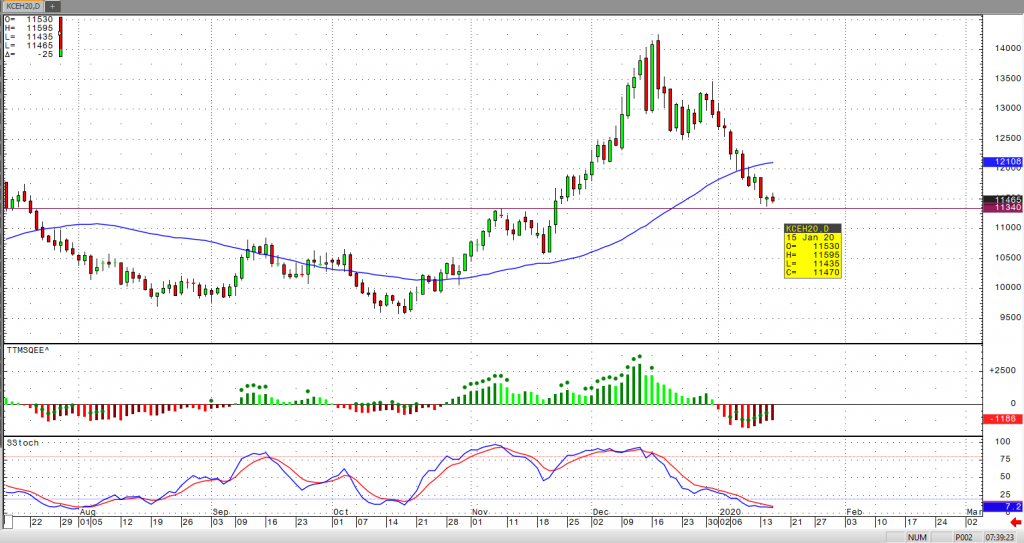
Metals - Can Gold Make It Back to the $1,600 Handle?
Can Gold Make It Back to the $1,600 Handle?
By: Nicholas DeGeorgePosted 01/17/2020
In the early morning trade, gold is trading slightly up this morning and still trying to make is back up to the $1,600. As I stated above, gold is pushing higher even in the strength of the U.S. dollar. There’s still a risk on appetite with gold along with the stock market making another all-time high but watch if that doesn’t start to unwind with the U.S./China Phase I Trade Deal signed Thursday, senate just passed the USMCA, and now positive news from the EU overnight on trade talks. Furthermore, China’s economic data came in slightly better overnight, which can prevent gold from making it back up to the $1,600 handle as risk trades are taken off.
If you take a quick look at the daily February gold chart, you can clearly see that the shiny one broke above resistance on Christmas Eve and was back in bullish trend. However, the high it made might not be legit because that was off the knee jerk reaction from the Iran missile strikes in retaliation of our President killing their terrorist leader Qasem Soleimani. Even though gold is in an uptrend it can still pull back all the way back down to the $1,500 handle, which there is strong support. Therefore, is gold going to $1,600 or $1,500 first?
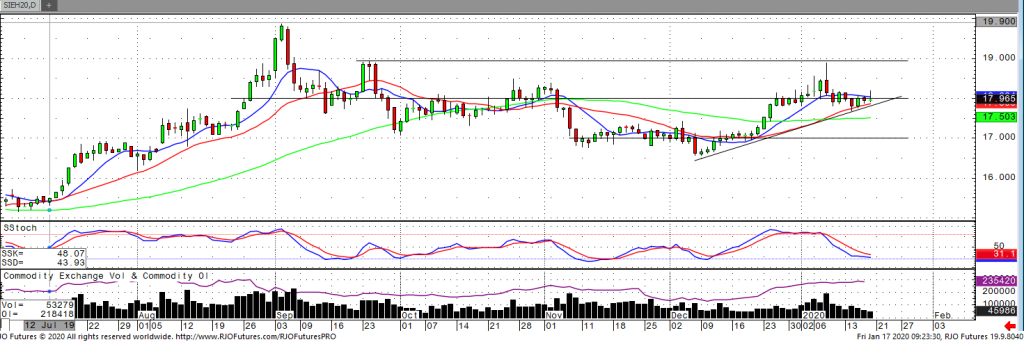
This week we saw lackluster trade for the March silver contract after last weeks failed run to 18.895. After opening at 18.130 on Monday, silver traded down to a weekly low of 17.690 on Tuesday before fighting back higher towards the second half of the week. Trade this week reiterates that 18.000 remains a key level in the March contract. With tensions in the middle east lessening and a risk-on attitude towards equities remaining in-tact, the bears have the upper had currently. Recent strength in the US dollar should also be added pressure to silver. Barring any fundamental changes, the short-term trend remains to the downside and any rallies will be short lived. A close under 17.750 should accelerate a move lower with 17.000-17.200 being the next level of support. A strong close over resistance at 18.000 is needed to reverse the trend back to the upside.
If you have any questions or would like to discuss the markets further, please feel free to contact me at 800-826-2270 or therrmann@rjofutures.com. Energy - Oil Up on Improved Outlook
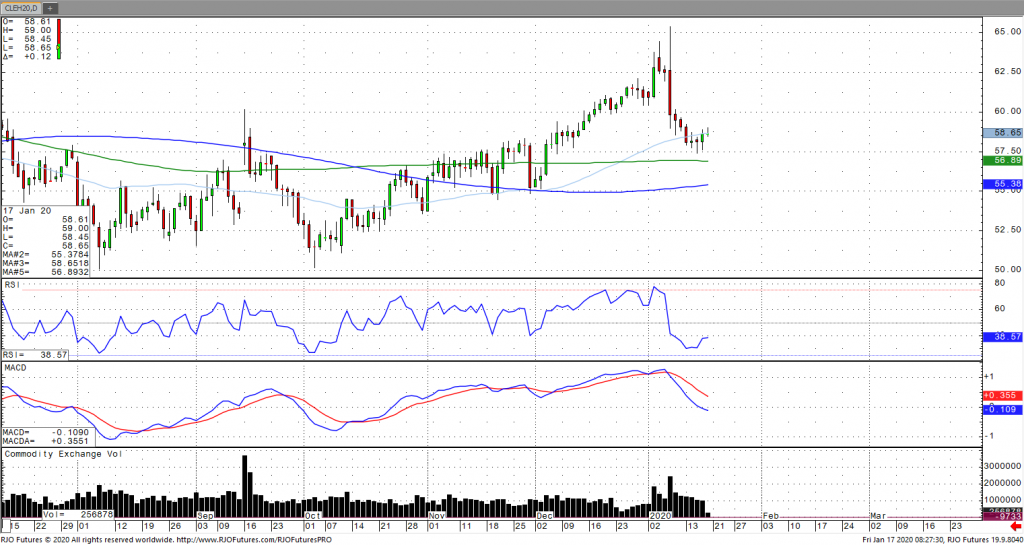
Oil Up on Improved Outlook
By: Alexander Turro, Senior Market StrategistPosted Jan 17, 2020 9:16AM CT
Oil prices are edging higher after rising more than 1% on Thursday following carryover optimism from the trade deal signing, signaling enhanced demand prospects. In addition, prices are receiving a lift this morning from positive Chinese industrial production and retail sales readings for December as well as reports that Chinese refineries processed an all-time high of 58.5 million tons of oil. This was coupled with Chinese December oil demand jumping close to 14% on year over year levels. This largely offsets reports that Libya increased oil production and Norway had stronger than expected oil output. The market discounted threat from Iran earlier this week, with Iran indicating that it will be enriching more uranium than under the 2015 Nuclear Agreement. Geopolitical risk remains unabated. Oil remains bullish trend with today’s range seen between 56.90 – 63.81.
If you have any questions or would like to discuss the markets further, please feel free to contact me at 800-438-4805 or aturro@rjofutures.com. Softs - Grinding Data and an Increased Demand
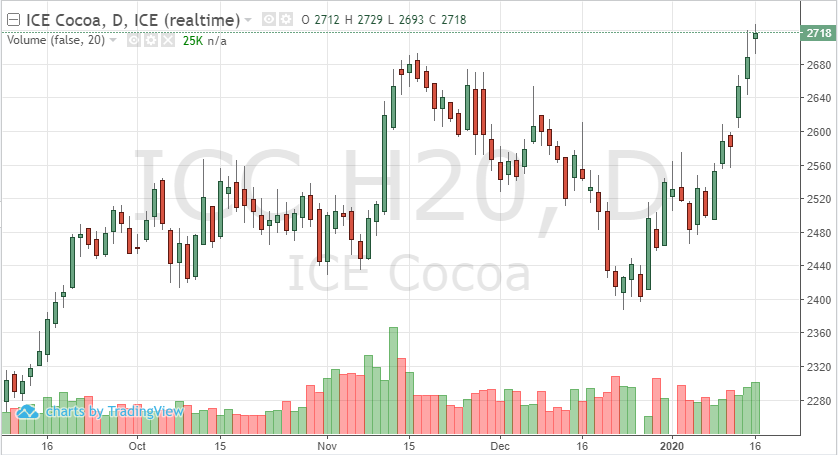
Grinding Data and an Increased Demand
By: Peter MoosesPosted 01/17/2020
Grinding data this week has cocoa futures testing highs from 2018. The March contract reached 2729 on Thursday. Asian demand increased and provided market support – leading to more speculative buying. European eemand was also up, paired with a stronger Eurocurrency, helped the market continue this follow-through move higher. If the N. American grinding data after Thursday’s close is also strong, look for 2750 to be tested. The street is anticipating a weaker number than other regions though. If this is the case, the market could see pullback back to 2680. If traders are looking for a short-term play, buying puts could be the path to exposure.
Technically,
the chart is poised for a move higher. The market continues to close above the
9-day moving average and continues to trade above the 200-day. Support is at
2680 if the market were to pullback if we reach overbought levels. Resistance
remains at 2730, above that 2750.
If N. American grinding surprises, 2800 could be touched over the next week. If the data comes inline, look to the currencies and global/political news to guide the cocoa futures again – as well as any tension in West Africa.
Softs - Coffee Coming Into Support
Coffee Coming Into Support
By: Adam TuiaanaPosted 01/15/2020
In my last article, I made mention that long liquidation was taking place, and we should begin to see some support being offered at the 113 level in March coffee prices. The fact still remains that tightening supplies are still on the horizon, which initially sparked this most recent, strong bull run over the past month. At the same time, we continue to make new highs in U.S. stocks, which should equate to steady demand for coffee. I am still very much bullish due to the fundamentals of March coffee.
Our friends at The Hightower Group shared that “coffee has a chance of seeing upside follow-through buying during today’s price action.” From a technical perspective, we have violated the 50-day moving average, and the 113 level is critical for holding support.
On
the heels of mid-Sep-to-early-Oct's steeper, accelerated, 3rd-wave-looking
recovery, the past week-and-a-half's boringly lateral chop is first considered
a corrective/consolidative event that warns of a continuation of the uptrend
that preceded it to new highs above 04-Oct's 891.0 high. This count
remains consistent with our broader base/correction/recovery count introduced
in 13-Sep's Technical Blog following that
day's bullish divergence in short-term momentum above 07-Sep's 809.5 minor
corrective high detailed in the hourly chart below.
The
important takeaway from this month's lateral, sleepy price action is the
definition of Wed's 851.5 low as
the end or lower boundary of a suspected 4th-Wave correction. A failure
below 851.5 will confirm a bearish divergence in daily momentum and defer or
threaten a bullish count enough to warrant non-bullish decisions like
long-covers. A failure below 851.5 will not
necessarily negate a broader bullish count, but it will threaten it enough to
warrant defensive measures as the next pertinent technical levels below 851.5 are
13-Sep's prospective minor 1st-Wave high at 813.8 and obviously 08-Sep's 766.0
low. And making non-bullish decisions "down there" is
sub-optimal to say the least. Per such, both short- and longer-term
commercial traders are advised to pare or neutralize bullish exposure on a
failure below 851.5, acknowledging and accepting whipsaw risk- back above 04-Oct's
891.0 high- in exchange for much deeper and sub-optimal nominal risk below
766.0.
On
a broader scale, the daily log scale chart above shows the developing potential
for a bearish divergence in daily momentum that will be considered confirmed
below 851.5. This chart also shows the past month's recovery thus far
stalling in the immediate neighborhood of the (888.0) Fibonacci
minimum 38.2% retrace of Apr-Sep's entire 1128 - 766 decline). COMBINED
with a failure below 851.5, traders
would then need to be concerned with at least a larger-degree correction pf the
past month's rally and possibly a resumption of Apr-Sep's major downtrend.
Until
and unless the market fails below 851.5 however, we would
remind longer-term players of the key elements on which our bullish count is
predicated:
a confirmed bullish divergence in WEEKLY momentum
(below)
amidst
an
historically low 11% reading in out RJO Bullish Sentiment Index and
a
textbook complete and major 5-wave Elliott sequence down from 29-Apr's
1128 high to 08-Sep's 766.0 low.
Thus
far, the market is only a month into correcting a 4-MONTH, 32% drawdown, so
further and possibly protracted gains remain well within the bounds of a major
(suspected 2nd-Wave) correction of Apr-Sep's decline within an even more
massive PEAK/reversal process from 17-May's 1219 high on an active continuation
basis below.
These
issues considered, a bullish policy and exposure remain advised with a failure
below 851.5 required to defer or threaten this call enough to warrant moving to
a neutral/sideline position. In lieu of such weakness, we anticipate a
continuation of the past month's rally to new highs and potentially significant
gains above 891.0.
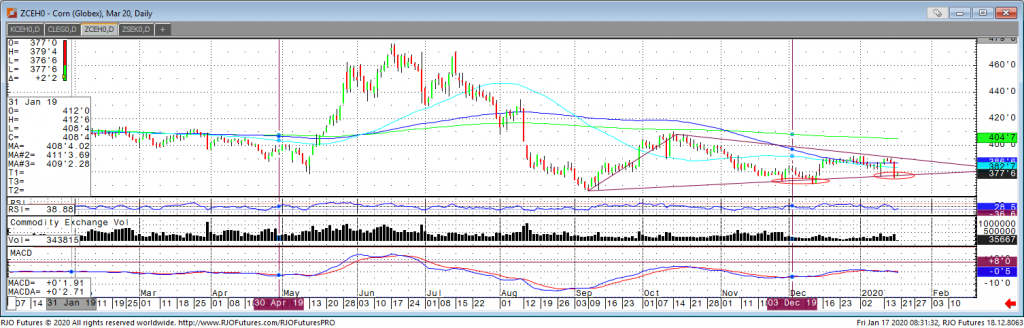
Agricultural - Corn Becoming Oversold, but Traders Want Evidence of Chinese Demand
Corn Becoming Oversold, but Traders Want Evidence of Chinese Demand
By: Tony Cholly, Senior Market StrategistPosted Jan 17, 2020 8:35AM CT
While the corn market has not shown that much direct impact from the big picture developments, prices should be supported as a result of definitive risk on vibe in equities, favorable Chinese economic data and from news of a South Korean KFA purchase of 66,000 tons of corn. While the trade deal agreement calls for China to purchase at least $40 billion of agricultural products over the next two years, compared with a 2017 base of near $24 billion, traders are still skeptical that China will actually purchase that amount. It would take “extremely” aggressive purchases of grain products to fulfil this commitment. This is what sparked aggressive selling in grain markets over the last couple trading sessions; people are unsure this commitment will be reached. While this is a concern, the market seems to have bottomed out, at least in the near term from this bearish demand news. In fact, moving forward demand news seems to have a good story just ahead. Resistance comes in at 381 and 391 while support hits at 369 and just under that again at 366.
If you have any questions or would like to discuss the markets further, please feel free to contact me at 800-826-2270 or tcholly@rjofutures.com. Currency - British Pound Looks Ripe for the Picking
British Pound Looks Ripe for the Picking
By: Ian BannonPosted 01/17/2020
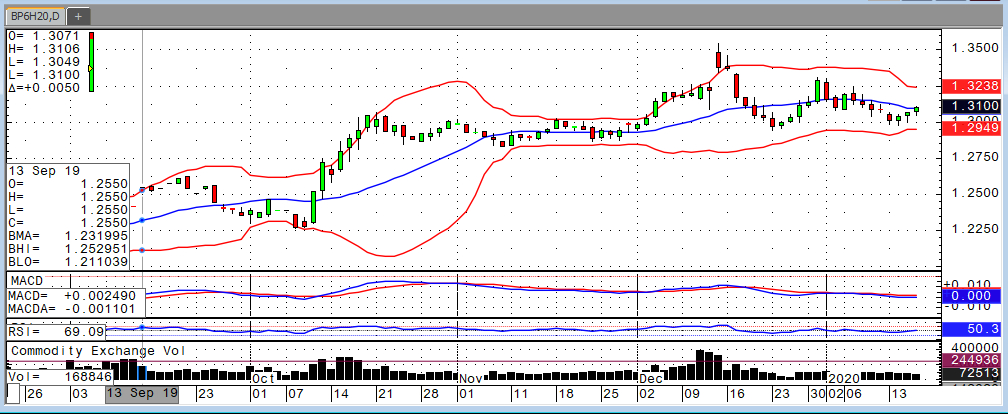
March U.S. dollar futures attempted a rebound during Thursday’s trade, settling at 97.04 while foreign currencies mostly finished lower. The British pound was the notable exception, finishing 0.37% higher for the day despite soft CPI data out of the UK on Wednesday. When nations are not meeting their inflation targets, lowering interest rates is the traditional path to higher domestic prices. The fact that this soft inflation data did not have a larger negative effect on the currency is a bullish factor. Furthermore, the pound respected technical support at the 1.30 level earlier in the week before moving higher. From a fundamental standpoint, it appears as though Brexit will be resolved in the near-term, which could help promote Boris Johnson’s business-oriented political agenda thus boosting demand for the UK currency. The Japanese yen looks the weakest of the major foreign currencies. Given the positive global sentiment, the yen has sold off to new lows in the March contract. If worry returns the markets, it is likely the yen will bounce higher given its safe-haven characteristics, but the overall pattern is very weak. The direction for currency futures will ultimately be dictated by the greenback. As of now, the path of least resistance in the U.S. dollar is pointed lower. This will prove to be true if the Fed must cut rates again in 2020.
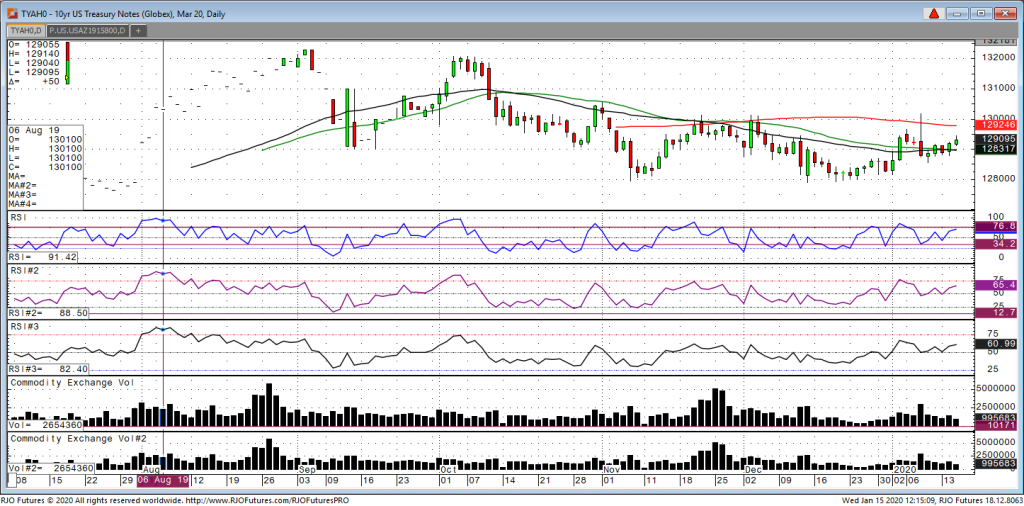
The treasuries, specifically the ten-year note, had a decent bid to them this morning and were trading at 129.10 up 5.5 ticks while having a high of 129.14 and a low of 129.04. The 10-year note has been acting well this week making three consecutive higher highs, so the short-term trend lies in the bull camp. Traders have been waiting for the phase one deal that was signed earlier today. We have not seen much reaction since most markets have already priced this deal in. The problem I see with the deal is that most don’t even know what the deal contained. My best guess is its nothing more than a truce as tariffs remain on China. I wouldn’t be surprised to see a "sell the fact" type of trade where many traders take profits off the table in stocks and start allocating some money in to Treasuries as a safe haven. I say this because there are still many uncertainties going forward with China and no one expects any new developments on working towards the “phase two deal” for a long time to come. Traders should expect a pickup in volatility as the phase one deal is now complete. I would encourage traders to keep a eye on the S&P 500 for a key reversal today, where a new contract high is made and then closes lower on the day. If that should happen, expect to see bids across the whole Treasury complex. The S&P is only up 1 point so the "sell the fact" trade might just come to fruition.
If you have any questions or would like to discuss the markets further, please feel free to contact me at 800-826-2270 or gperlin@rjofutures.com. Equity - Stocks Hit Another New High
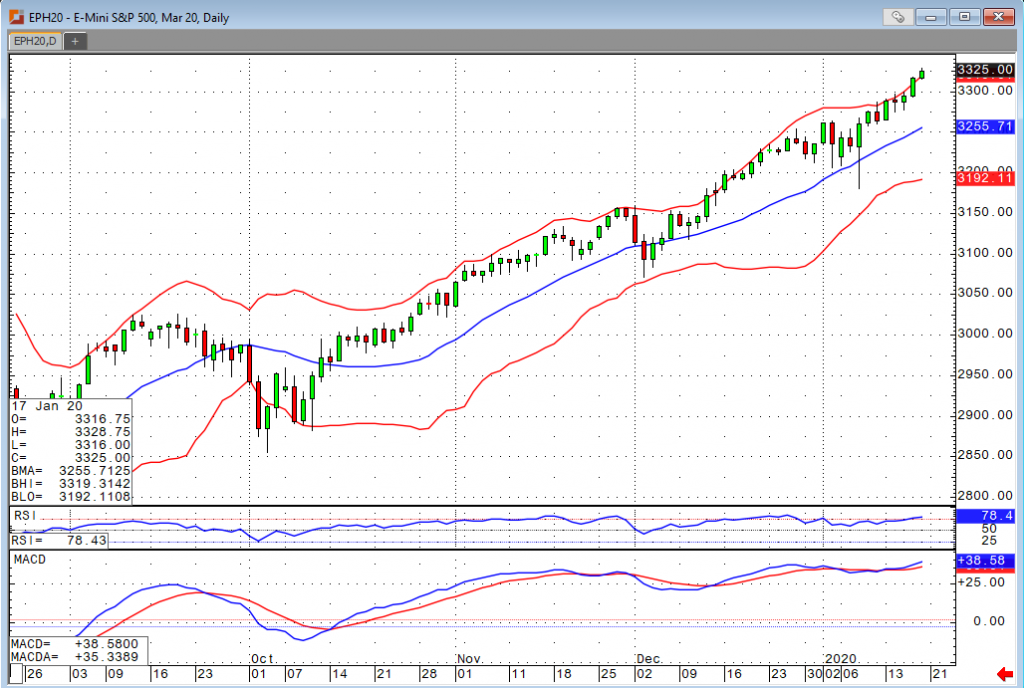
Stocks Hit Another New High
By: Bill Dixon, Senior Market StrategistPosted Jan 17, 2020 9:11AM CT
All four of the major U.S. indices printed fresh new highs preopen. While we’re certainly seeing some overbought readings, I’m also showing several momentum studies that still project even higher prices. Technical trading becomes a bit more difficult now that we’re literally in uncharted territory, so keep an eye on the news concerning China, developments about a possible deal with the EU, and of course, earnings. Today’s slate of data is relatively light, but we saw a nice housing starts number earlier. We were expecting to see the starts figure come out at 1.373, but we posted an impressive 1.608M. Permits, on the other hand, were in range but slightly below consensus. We’ll be looking forward to the consumer sentiment data as well. It is expected to come in strong at 99.3.
Many of the markets have short hours or are closed altogether on Monday in observance of Martin Luther King Jr. Day. The rest of the week’s slate of data is very light, but earnings should make things a bit more interesting. Traders will be looking forward to the following week when the FOMC gets together for a two-day meeting on 1/28 & 1/29. We’re not expecting any cuts or hikes, but we’ll be looking for clues into potential for either moving forward. For what it’s worth, the FOMC said last month that they’re not forecasting any more cuts for the foreseeable future. With other central banks continuously lowering their rates, I personally find that a bit hard to believe. That said, I do think any cuts we’ll make will be a bit more reactionary than proactive.
If you have any questions or would like to discuss the markets further, please feel free to contact me at 800-669-5354 or bdixon@rjofutures.com. Economy - S-T Mo Failure Insufficient to End RBOB Correction, But Beware
S-T Mo Failure Insufficient to End RBOB Correction, But Beware
By: RJO Market InsightsPosted 11/08/2022
Posted on Nov 08, 2022, 07:51 by Dave Toth
In Fri's Technical Webcast we identified a
minor corrective low at 2.6328 from Thur as a mini risk parameter the market
needed to sustain gains above to maintain a more immediate bullish count.
The 240-min chart below shows the market's failure overnight below this level,
confirming a bearish divergence in very short-term momentum. This mo
failure defines Fri's 2.8172 high as
one of developing importance and a parameter from which very short-term traders
can objectively base non-bullish decisions like long-covers.
Given
the magnitude of the past three weeks' broader recovery however, this
short-term momentum failure is of an insufficient scale to conclude anything
more than another correction within this broader recovery from 26-Sep's 2.1877
low. Indeed, overnights failure below 2.6328 only allows us to conclude
the end of the portion of the month-and-a-half rally from 31-Oct's 2.4822 next
larger-degree corrective low. 2.4822 is the
risk parameter this market still needs to fail below to break the uptrend from
18-Oct's 2.3526 low while this 2.3526 low
remains intact as the risk parameter this market needs to fail below to break
the month-and-a-half uptrend. From an
intermediate-to-longer-term perspective, this week's setback falls well within
the bounds of another correction ahead of further gains. This is another
excellent example of the importance of technical and trading SCALE and
understanding and matching directional risk exposure to one's personal risk
profile.
The
reason overnight's admittedly minor mo failure might have longer-term
importance is the 2.8172-area from which it stemmed. In
Fri's Technical Blog we also noted the market's engagement of the
2.8076-to-2.8159-area marked by the 61.8% retrace of Jun0-Sewp's 3.2758 -2.1877
decline and the 1.000 progression of Sep-Oct's initial 2.1877 - 2.6185
(suspected a-Wave) rally from 18-Oct's 2.3526 (suspected b-Wave) low. We
remind longer-term players that because of the unique and compelling confluence
of:
early-Aug's bearish divergence in WEEKLY momentum
amidst
historically
extreme bullish sentiment/contrary opinion levels in our RJO Bullish
Sentiment Index
an
arguably complete and massive 5-wave Elliott sequence from Mar'20's 0.4605
low to Jun's 4.3260 high (as labeled in the weekly log active-continuation
chart below) and
the
5-wave impulsive sub-division of Jun-Sep's (suspected initial 1st-Wave) decline
The
recovery attempt from 26-Sep's 2.1877 low is arguably only a 3-wave (Wave-2)
corrective rebuttal to Jun-Sep's decline within a massive, multi-quarter
PEAK/reversal process. Now granted, due to the magnitude of 2020 -2022's
secular bull market, we discussed the prospect for this (2nd-Wave corrective)
recovery to be "extensive" in terms of both price and time. A
"more extensive" correction is typified by a retracement of 61.8% or
more and spanning weeks or even months following a 3-month decline. Per
such, the (suspected corrective) recovery from 26-Sep's 2.1877 low could easily
have further to go, with commensurately larger-degree weakness than that
exhibited this week (i.e., a failure below at least 2.4822) required
to consider the correction complete. Indeed, the daily log chart above
shows the market thus far respecting former 2.6185-area resistance from 10-Oct
as a new support candidate.
These
issues considered, very shorter-term traders have been advised to move to a neutral/sideline
position following overnight's momentum failure below 2.6328, with a recovery
above 2.8172 required to negate this call, reaffirm the recovery and re-expose
potentially significant gains thereafter. For intermediate- and
longer-term players, a bullish policy and exposure remain advised with a
failure below 2.4822 required to threaten this call enough to warrant
neutralizing exposure. We will be watchful for another bearish divergence
in momentum following a recovery attempt that falls short of Fri's 2.8172 high
that would be considered the next reinforcing factor to a count calling that
2.8172 high the prospective end to the month-and-a-half 2nd-Wave
correction. In lieu of such, a resumption of the current rally to
eventual new highs above 2.8172 should not surprise.