Technical analysis and trading strategy applicable to these markets
The Markets
Metals - April Gold Needs a Fresh Bull Catalyst
April Gold Needs a Fresh Bull Catalyst
By: Joshua GravesPosted 01/24/2020
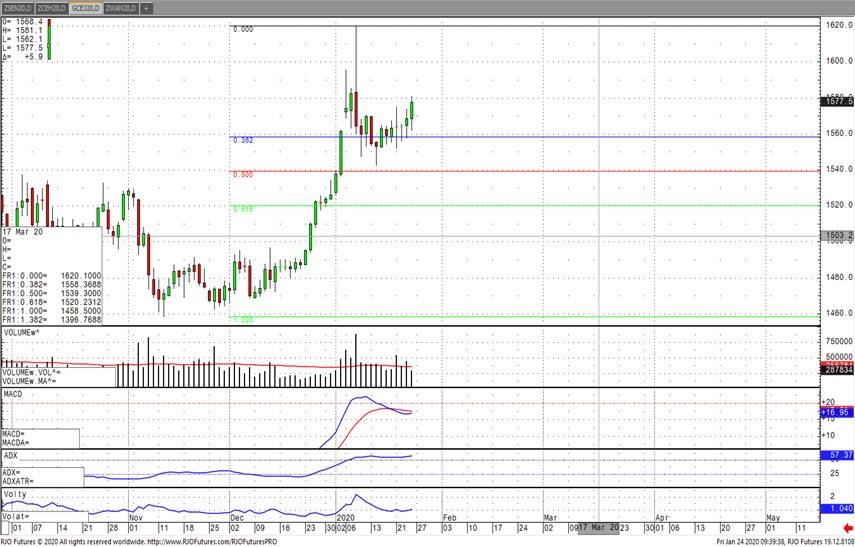
April gold has been fairly choppy over the past few weeks,
following the Iraq attack which pushed gold soaring to 7-year highs above
$1600. I think the best way to trade gold right now is based off of two
factors. The first, being the technical price action and analyzing how gold
prices are moving in conjunction with volume. A big move up or down with rising
volume behind it is always something traders should pay attention to. It
doesn’t necessarily mean it’s going to continue in that direction, but it is something
that adds confidence in the direction. The forever gold bulls out there are
clearly watching the corona virus for the most recent bullish news to feed the
market. As it appears this virus is quite contagious and is spreading fast.
There are now more confirmed cases in the US with this entire situation similar
to the start of the SARS virus in the early 2000’s. China is taking all
precautions with over 40M people in quarantine areas now.
April gold recently broke out above $1575, with the next
target being that all too important $1600 level. On the flip side, look to be
short gold with a move beneath $1542. I don’t think a virus from China is
enough to push gold up there alone, but should there be anything else that
might come out updating the situation for the worse all bets are off. Traders
should be using futures options to get exposure to gold when something as
potentially serious as a “worldwide epidemic” is in its early stages.
By: Eli Tesfaye, Senior Market StrategistPosted Jan 23, 2020 1:35PM CT
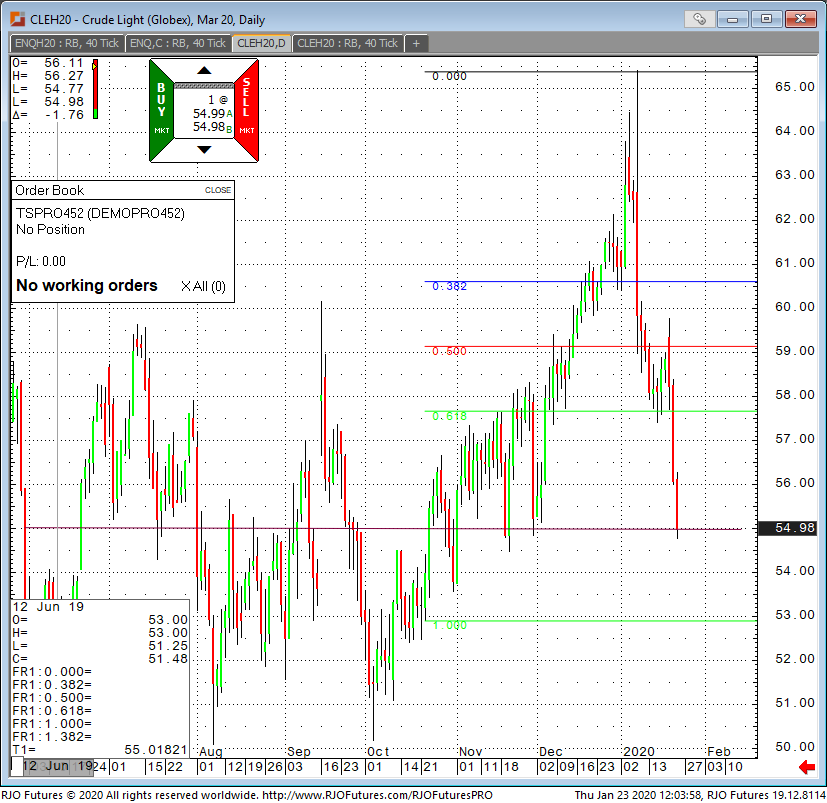
Crude oil is at the lowest it’s been since Nov 2019. The
Coronavirus that is making its way around is contributing to the recent crazy
sell-off. The virus is spreading from
central China's city of Wuhan to other cities around the world. The world
health organization is declaring this a global risk the same as SARS and MARS
or worse.
Chinese health officials have lockdown cities, and ministers
are advising everyone to stay in or out. Oil demand is taking a hit with supply
plenty right now. The technical damage done on the chart shall remain. Any sign
of getting a handle on Wuhan virus would probably induce a relief rally.
From a technical perspective, the market is in near-term support; and my analysis is that it would not sell off much more than this unless the economic impact of 2019-nCoV expands around the world at an alarming rate. Sideways to lower price action most likely be the case here.
If you have any questions or would like to discuss the markets further, please feel free to contact me at 800-367-7290 or etesfaye@rjofutures.com. Softs - Sugar Market Sees a Reversal
Sugar Market Sees a Reversal
By: Eric ScolesPosted 01/24/2020
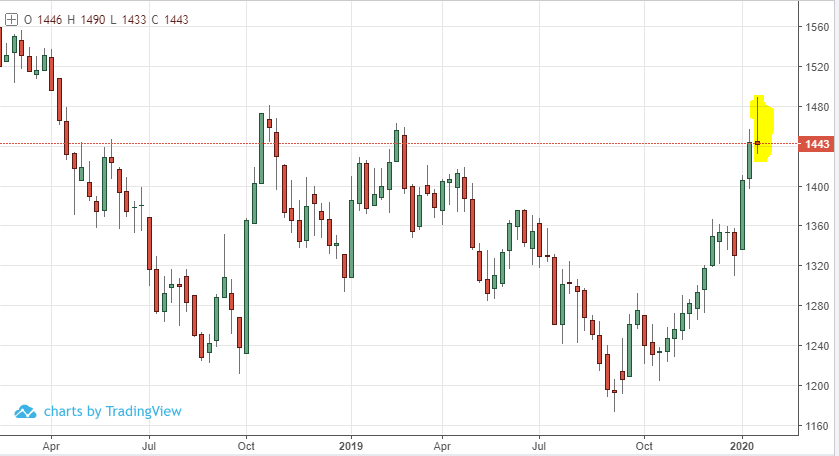
Mar ’20 sugar futures follow through yesterday’s negative
reversal amid crashing oil prices and Coronavirus precautions. Yesterday’s
prices poked higher before reversing down closing negative which is a bearish
indicator. The weekly chart looks likely to show a negative reversal as well,
an even more significant bearish indicator. This Reversal is strongly tied to
the washout in crude oil prices as that impacts the demand for ethanol, and
ethanol requires sugar for its production. Sugar has been ready for a
correction having become overbought from a technical perspective, the viral
outbreak and its impact on related markets was simply the catalyst. From a
fundamental perspective this market is still very bullish, and prices are
currently holding at a support level (14.43), but we are likely to see prices
fall further as many take profit and cover their long positions. In my opinion
this pullback could be a great bullish opportunity to buy in at a better price,
just be patient and let this situation play out a little further first.
**For a free consultation call my direct line at (312) 373-4875** you may also send me an email at escoles@rjofutures.com
Softs - Will Cotton Recover?
Will Cotton Recover?
By: Eric ScolesPosted 01/22/2020
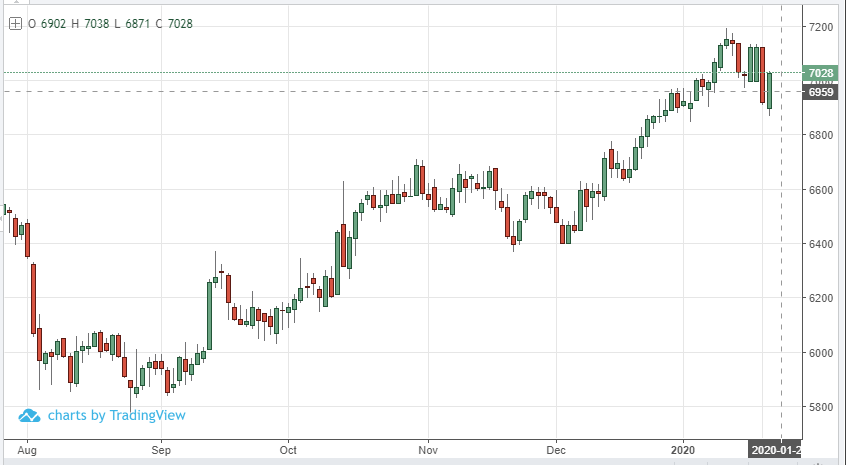
Mar ’20 Cotton futures started the session down further today but have rapidly recovered and have re-entered the previous consolidation range. It would be a strong bullish indicator on the charts if after having taken out the previous lows the market closes in positive. There appears to be firm resistance and a possible top around the 71.36. Cotton is noted as being economically sensitive product and right now Asian demand is a significant factor. Yesterday’s price drop is likely tied to news of the corona virus outbreak reported out of China which could be a threat to demand and speculative risk mentality if it is not quickly contained. There is a lot of support for cotton as demand is still strong but there needs to be confirmation of purchases out of China to really drive this market higher.
On
the heels of mid-Sep-to-early-Oct's steeper, accelerated, 3rd-wave-looking
recovery, the past week-and-a-half's boringly lateral chop is first considered
a corrective/consolidative event that warns of a continuation of the uptrend
that preceded it to new highs above 04-Oct's 891.0 high. This count
remains consistent with our broader base/correction/recovery count introduced
in 13-Sep's Technical Blog following that
day's bullish divergence in short-term momentum above 07-Sep's 809.5 minor
corrective high detailed in the hourly chart below.
The
important takeaway from this month's lateral, sleepy price action is the
definition of Wed's 851.5 low as
the end or lower boundary of a suspected 4th-Wave correction. A failure
below 851.5 will confirm a bearish divergence in daily momentum and defer or
threaten a bullish count enough to warrant non-bullish decisions like
long-covers. A failure below 851.5 will not
necessarily negate a broader bullish count, but it will threaten it enough to
warrant defensive measures as the next pertinent technical levels below 851.5 are
13-Sep's prospective minor 1st-Wave high at 813.8 and obviously 08-Sep's 766.0
low. And making non-bullish decisions "down there" is
sub-optimal to say the least. Per such, both short- and longer-term
commercial traders are advised to pare or neutralize bullish exposure on a
failure below 851.5, acknowledging and accepting whipsaw risk- back above 04-Oct's
891.0 high- in exchange for much deeper and sub-optimal nominal risk below
766.0.
On
a broader scale, the daily log scale chart above shows the developing potential
for a bearish divergence in daily momentum that will be considered confirmed
below 851.5. This chart also shows the past month's recovery thus far
stalling in the immediate neighborhood of the (888.0) Fibonacci
minimum 38.2% retrace of Apr-Sep's entire 1128 - 766 decline). COMBINED
with a failure below 851.5, traders
would then need to be concerned with at least a larger-degree correction pf the
past month's rally and possibly a resumption of Apr-Sep's major downtrend.
Until
and unless the market fails below 851.5 however, we would
remind longer-term players of the key elements on which our bullish count is
predicated:
a confirmed bullish divergence in WEEKLY momentum
(below)
amidst
an
historically low 11% reading in out RJO Bullish Sentiment Index and
a
textbook complete and major 5-wave Elliott sequence down from 29-Apr's
1128 high to 08-Sep's 766.0 low.
Thus
far, the market is only a month into correcting a 4-MONTH, 32% drawdown, so
further and possibly protracted gains remain well within the bounds of a major
(suspected 2nd-Wave) correction of Apr-Sep's decline within an even more
massive PEAK/reversal process from 17-May's 1219 high on an active continuation
basis below.
These
issues considered, a bullish policy and exposure remain advised with a failure
below 851.5 required to defer or threaten this call enough to warrant moving to
a neutral/sideline position. In lieu of such weakness, we anticipate a
continuation of the past month's rally to new highs and potentially significant
gains above 891.0.
Agricultural - Grain Futures Update w/Stephen Davis - 01/24/2020
Grain Futures Update w/Stephen Davis - 01/24/2020
By: Stephen DavisPosted 01/24/2020
Feel free to contact Stephen here to leave a question or comment on his video.Agricultural - China To Begin Importing U.S. Pork
China To Begin Importing U.S. Pork
By: Peter McGinnPosted 01/22/2020
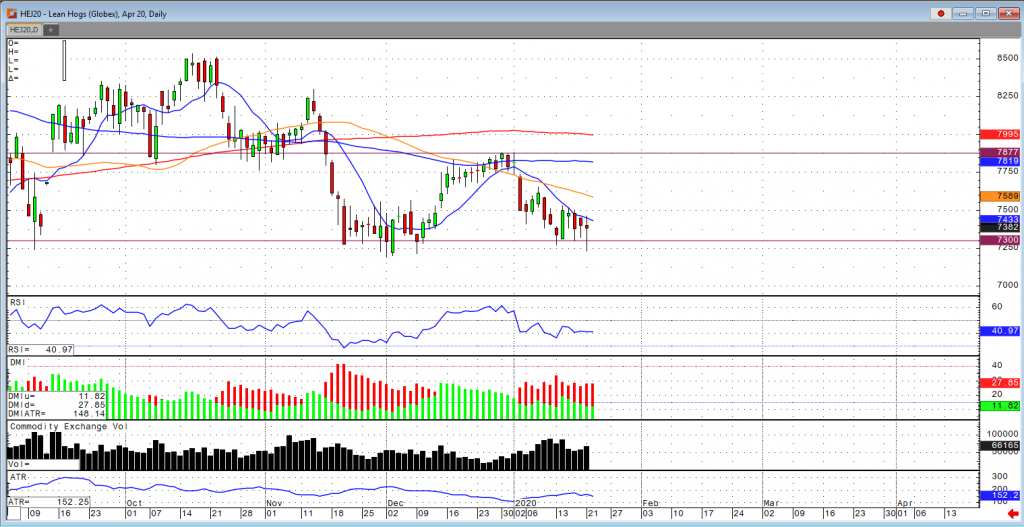
The April hogs market seemed to reject the downside breakout by hitting a level not seen since December 9th but rallied to close 150 points off the lows. China has a huge demand for U.S. pork and will start to actively import our pork which should cause U.S. supplies to start tightening after reaching record high levels. The pork cut-out values are the highest since middle December which gives an indication that there is still high demand. China’s national average spot pig price is up 7.3% for the month and over 200% year over year. CME’s hog index is at $60.45 which is up from last week’s price of $58.99. The path of least resistance is upward in the pork market and I suspect that the April Hog market will test the 10-day moving average and break through that level to re-test the December highs of 78.75 over the next 30-day time period. The USDA estimated hog slaughter came in at 498,000 head yesterday. This brings the total for the week so far to 909,000 head, down from 995,000 last week, but up from 867,000 a year ago. The USDA pork cutout, released after the close yesterday, came in at $77.37, up $1.21 from $76.16 on Monday and up from $73.43 the previous week and $69.45 a year ago. This is the highest the cutout has been since December 17.
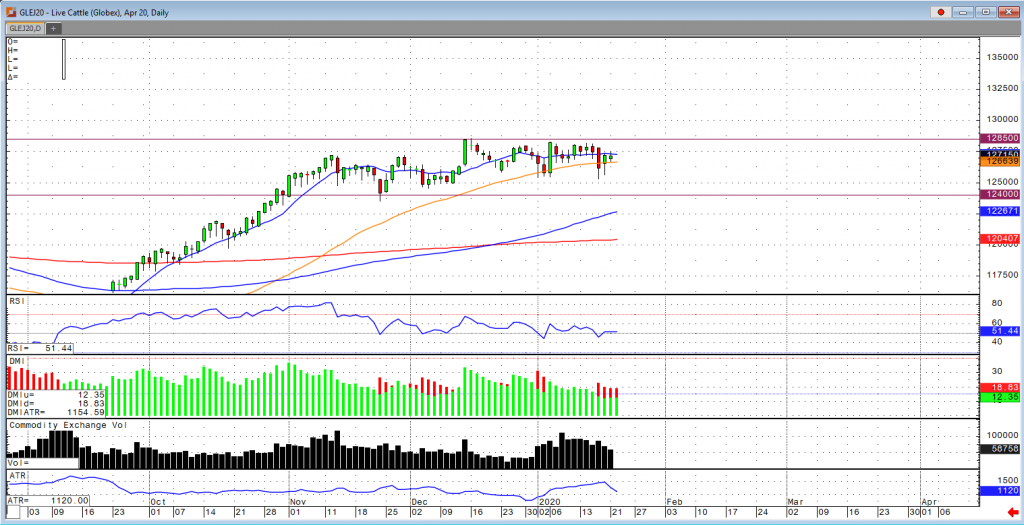
April live cattle continues to trade in a consolidated market for the past 2 ½ months, trading in a price range from $125 to $128 with the market hitting a low of $124 back on November 22nd. These prices still remain at a $3-$4 premium to the cash market and with a steady rise of open interest in the market, that gives an indication that this market could break out of this range to the upside. If we were to see higher cash market prices, we would need to see stronger beef price action before anything else. There were no cash trades reported for Tuesday, but on Monday we had 126 head reported at $124, the lower end of last week’s range.
Fundamentally, there is little positive weather premium in the futures market as another winter system moves through the Midwest. The USDA estimated cattle slaughter came in at 123,000 head yesterday. This brings the total for the week so far to 245,000 head, up from 244,000 last week and up from 233,000 a year ago. The USDA boxed beef cutout was up 79 cents at mid-session yesterday but closed 13 cents lower at $214.51. This was up from $212.76 the previous week but down from $215.26 a year ago. The COT report showed managed money traders were net buyers of 2,917 cattle contracts for the week ending January 14, increasing their net long position to 83,603. The estimated slaughter came in at 631,000 head last week, down from 640,000 the previous week but up from an actual slaughter of 626,000 a year ago. The estimated average dressed steer weight was 829 pounds last week, up from 827 the previous week and 818 a year ago. Estimated beef production came in at 521.8 million pounds last week, down from 528.1 million the previous week and up from 511.1 million a year ago.
Currency - Save the Date: BREXIT DAY January 31
Save the Date: BREXIT DAY January 31
By: John Caruso, Senior Market StrategistPosted Jan 24, 2020 8:57AM CT
With the ever present Brexit talk casting doubt over the
future of the UK for the past 3yrs, it looks as if we’re finally set to find
some closure, maybe. The UK passed it Brexit bill earlier this month
through the House of Commons and the House of Lords, and set Jan 31 as the
official day when the UK parts ways with the EU for good. Following the
official Brexit date, the UK and the EU may then begin negotiations on trade
and other various economic and logistical issues involved in the split.
As we wade through a year’s worth of negotiations between the two sides, it has
our attention turned to the British Pound.
The Big Picture
My analysis suggests that the British Pound could outperform
this year with more clarity surrounding the future of the UK. Boris
Johnson has largely been regarded as a “Pro Business” PM, and will attempt to
harbor foreign investment back into the UK, which has largely been scarce since
the onset of Brexit and the uncertainty surrounding the future of the UK’s
economy. More outside investment, creates more demand for that host
countries currency, in this case the British Sterling.
The Near-term View
With a broad based economic slowdown across the European
region for the past 1-2yrs, including the UK, we’re beginning to find a light
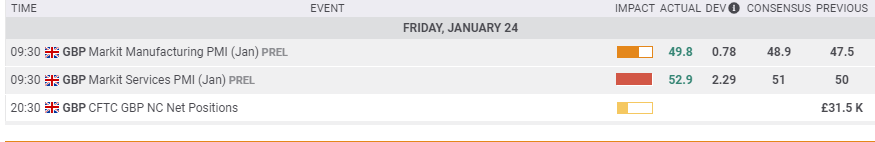
at the end of the tunnel, we think. Specifically in the UK, with further
clarity regarding Brexit, a recent health Employment report (208K jobs added in
the UK last quarter), and an acceleration of the UK PMI data released this
morning (not strong by any stretch, BUT an acceleration indeed) – We’ll now
turn our attention to the Band of England and there decision on monetary policy
on Jan 30th . Prior to the PMI data released, consensus put a
60% chance of a rate cut by the BOE at this month’s meeting. I’m less
convinced, and expect the BOE to take a “wait and see” approach. It’s
very close. Going forward, we do expect a modest acceleration in the UK
economy and certainly having the uncertainties surround Brexit nearing the
rear-view mirror, we think the British Pound will outperform going
forward.
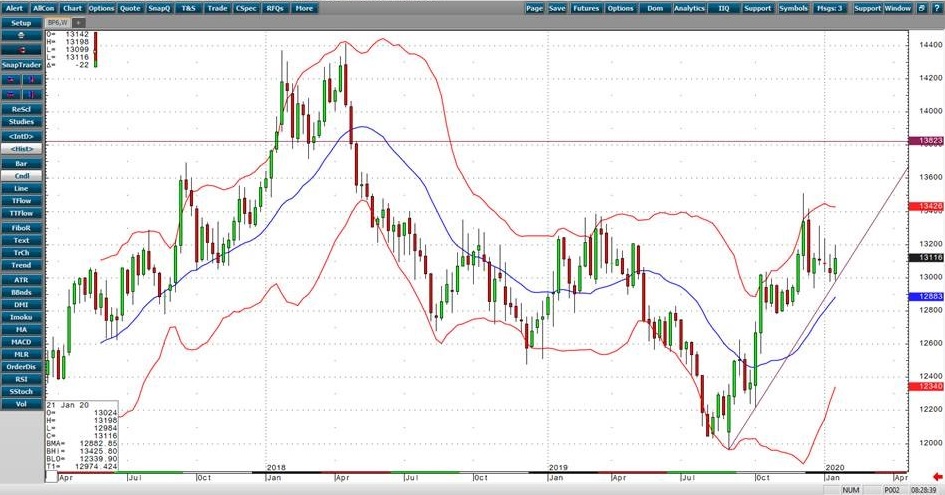
Techincals:
Near-term Bullish trade (1-3 weeks) and trend (3-6 month
time frame) – Favorable Entry Level 1.3060. A break of 1.2780 will tip
the 3-6 month trend and we’ll have to re-check our premise at that point.
If you have any questions or would like to discuss the markets further, please feel free to contact me at 800-669-5354 or jcaruso@rjofutures.com. Equity - No Panic in the Stock Market
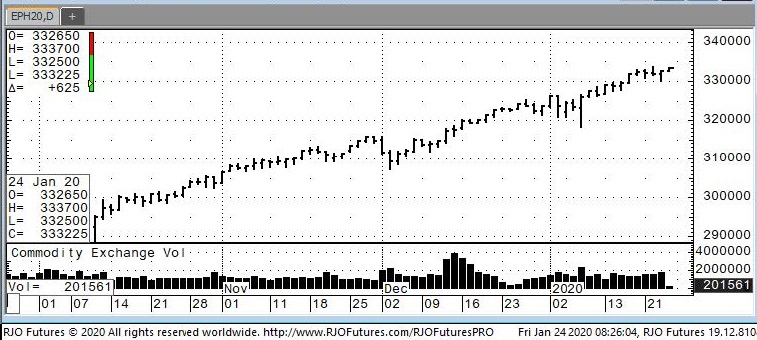
No Panic in the Stock Market
By: Jeff Yasak, Senior Market StrategistPosted Jan 24, 2020 9:34AM CT
Stock Futures in the U.S. were higher this morning on positive economic data and earnings that, for the time being, outweighed the fears coming from the coronavirus in China. China has made efforts to contain the spreading virus before one of the busiest traveling days, the Lunar New Year. While strong quarterly results from American Express and Intel along with good European economic data has kept the market positive.
The death toll from the virus was 25, with more than 750 confirmed worldwide cases. This prompted the Chinese government to force the halt of domestic and international tours from the country’s travel agencies. The WHO, World Health Organization, has stopped just short of declaring this a global health emergency.
Germany’s PMI, Purchasing Managers’ Index, that was released today showed the country’s private sector had gained momentum in January and the pullback in manufacturing has eased. The same index out of the UK also rebounded sharply this month with a nine month high.
U.S. Stocks remained close to al-time highs as reports from tech stocks led this morning’s earnings report. Shares of American Express rallied higher, over 5%, as fourth quarter profits beat expectations. While Intel jumped 7% after the stronger than anticipated data-center sales were released.
Resistance is checking in today at 333900 and 334500 while support is showing 331200 and 329400.
If you have any questions or would like to discuss the markets further, please feel free to contact me at 888-861-1656 or jyasak@rjofutures.com. Economy - S-T Mo Failure Insufficient to End RBOB Correction, But Beware
S-T Mo Failure Insufficient to End RBOB Correction, But Beware
By: RJO Market InsightsPosted 11/08/2022
Posted on Nov 08, 2022, 07:51 by Dave Toth
In Fri's Technical Webcast we identified a
minor corrective low at 2.6328 from Thur as a mini risk parameter the market
needed to sustain gains above to maintain a more immediate bullish count.
The 240-min chart below shows the market's failure overnight below this level,
confirming a bearish divergence in very short-term momentum. This mo
failure defines Fri's 2.8172 high as
one of developing importance and a parameter from which very short-term traders
can objectively base non-bullish decisions like long-covers.
Given
the magnitude of the past three weeks' broader recovery however, this
short-term momentum failure is of an insufficient scale to conclude anything
more than another correction within this broader recovery from 26-Sep's 2.1877
low. Indeed, overnights failure below 2.6328 only allows us to conclude
the end of the portion of the month-and-a-half rally from 31-Oct's 2.4822 next
larger-degree corrective low. 2.4822 is the
risk parameter this market still needs to fail below to break the uptrend from
18-Oct's 2.3526 low while this 2.3526 low
remains intact as the risk parameter this market needs to fail below to break
the month-and-a-half uptrend. From an
intermediate-to-longer-term perspective, this week's setback falls well within
the bounds of another correction ahead of further gains. This is another
excellent example of the importance of technical and trading SCALE and
understanding and matching directional risk exposure to one's personal risk
profile.
The
reason overnight's admittedly minor mo failure might have longer-term
importance is the 2.8172-area from which it stemmed. In
Fri's Technical Blog we also noted the market's engagement of the
2.8076-to-2.8159-area marked by the 61.8% retrace of Jun0-Sewp's 3.2758 -2.1877
decline and the 1.000 progression of Sep-Oct's initial 2.1877 - 2.6185
(suspected a-Wave) rally from 18-Oct's 2.3526 (suspected b-Wave) low. We
remind longer-term players that because of the unique and compelling confluence
of:
early-Aug's bearish divergence in WEEKLY momentum
amidst
historically
extreme bullish sentiment/contrary opinion levels in our RJO Bullish
Sentiment Index
an
arguably complete and massive 5-wave Elliott sequence from Mar'20's 0.4605
low to Jun's 4.3260 high (as labeled in the weekly log active-continuation
chart below) and
the
5-wave impulsive sub-division of Jun-Sep's (suspected initial 1st-Wave) decline
The
recovery attempt from 26-Sep's 2.1877 low is arguably only a 3-wave (Wave-2)
corrective rebuttal to Jun-Sep's decline within a massive, multi-quarter
PEAK/reversal process. Now granted, due to the magnitude of 2020 -2022's
secular bull market, we discussed the prospect for this (2nd-Wave corrective)
recovery to be "extensive" in terms of both price and time. A
"more extensive" correction is typified by a retracement of 61.8% or
more and spanning weeks or even months following a 3-month decline. Per
such, the (suspected corrective) recovery from 26-Sep's 2.1877 low could easily
have further to go, with commensurately larger-degree weakness than that
exhibited this week (i.e., a failure below at least 2.4822) required
to consider the correction complete. Indeed, the daily log chart above
shows the market thus far respecting former 2.6185-area resistance from 10-Oct
as a new support candidate.
These
issues considered, very shorter-term traders have been advised to move to a neutral/sideline
position following overnight's momentum failure below 2.6328, with a recovery
above 2.8172 required to negate this call, reaffirm the recovery and re-expose
potentially significant gains thereafter. For intermediate- and
longer-term players, a bullish policy and exposure remain advised with a
failure below 2.4822 required to threaten this call enough to warrant
neutralizing exposure. We will be watchful for another bearish divergence
in momentum following a recovery attempt that falls short of Fri's 2.8172 high
that would be considered the next reinforcing factor to a count calling that
2.8172 high the prospective end to the month-and-a-half 2nd-Wave
correction. In lieu of such, a resumption of the current rally to
eventual new highs above 2.8172 should not surprise.