Looking to diversify your investment portfolio with futures trading, but lack the expertise on your own? Trading Systems and their programs are now listed on our website complete with track records, products traded and minimum account requirements and fees. If you need help navigating the site and viewing the results, give us a call.
New Special Report: Inflation, How Much is Too Much?
With so much money in the market, coupled with weakened supply chains and workforces due to the fallout of Covid-19, we are seeing a rampant run on inflation. Prices from everything to lumber, oil, and groceries are up. Learn why this is happening, how long it will go on for, and how to protect yourself with this Special Report!
The Markets
Metals - Gold Falls as Dollar Gains
Gold Falls as Dollar Gains
By: RJOF Editorial TeamPosted 01/28/2022
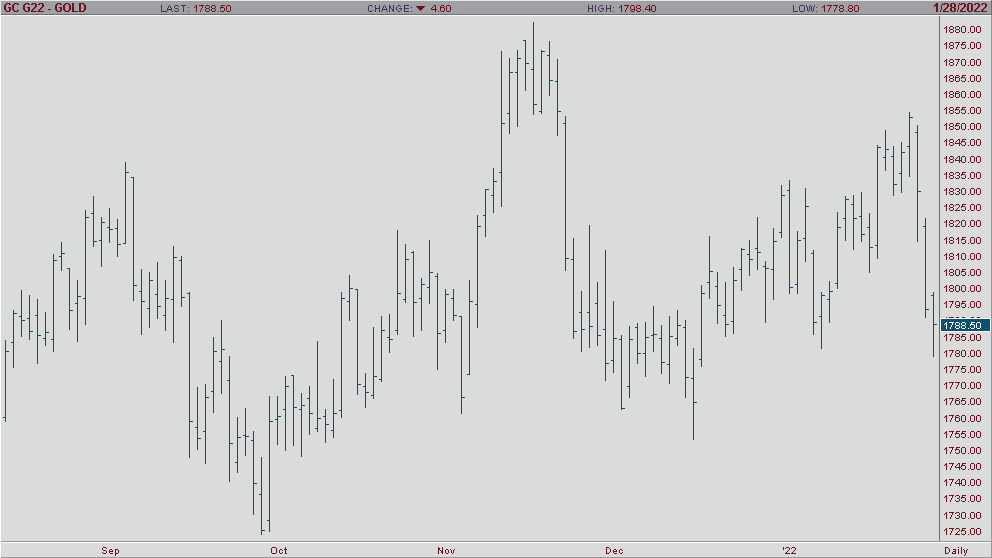
After starting the week strong and reaching a 10-week high on the stock market sell-off, gold futures have fallen of a cliff to end the week. As it stands, we are 3% off Tuesday’s high and tracking to close below $1,800. This is likely due to the hawkish news out of the Fed we saw on Wednesday. The U.S. saw its strongest economic growth since 1984 and that coupled with the news of rate hikes propped the U.S. dollar up the highest level it’s been since July 2020. The Fed rate hikes are supposed to start in March and we’ll have a better understanding just how much they will impact gold then. In the meantime, keep an eye on gold and the USD in the next few weeks. The action we saw during the backend of this week could be an overreaction to the news we got from the Fed on Wednesday, or it could be a sign of a larger trend to come.
Gold Feb '22 Daily ChartMetals - Beware of Bear Trap in Silver
Beware of Bear Trap in Silver
By: Eli Tesfaye, Senior Market StrategistPosted Jan 28, 2022 12:39PM CT
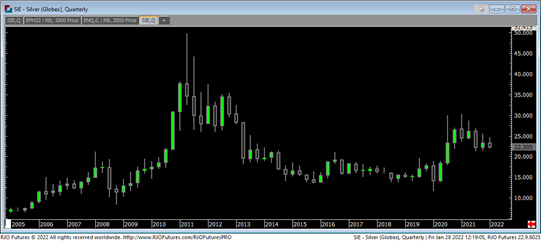
The silver market is selling into a congested price structure. So long as the market stays above $21.50, it will probably not lead to an accelerated sell-off. I'm hearing from folks familiar with the physical silver market that there is a slight increase in physical silver demand at these levels $22.00 area. As I have stated already, options might be a better approach for those looking to test the market. A close over $23.50 will set a stage for another uptrend from a technical perspective. Another indication that silver will hold the current level is inflation and other commodity prices. Higher commodity prices and inflation uptick will garner enough support to keep silver stable in these areas for a tad longer. Please reach out to me if you would like to discuss this in-depth.
Silver Quarterly Chart If you have any questions or would like to discuss the markets further, please feel free to contact me at 800-367-7290 or etesfaye@rjofutures.com. Energy - Oil Prices Headed for Sixth Weekly Gain Amid Tight Supply
Oil Prices Headed for Sixth Weekly Gain Amid Tight Supply
By: Alexander Turro, Senior Market StrategistPosted Jan 28, 2022 10:01AM CT
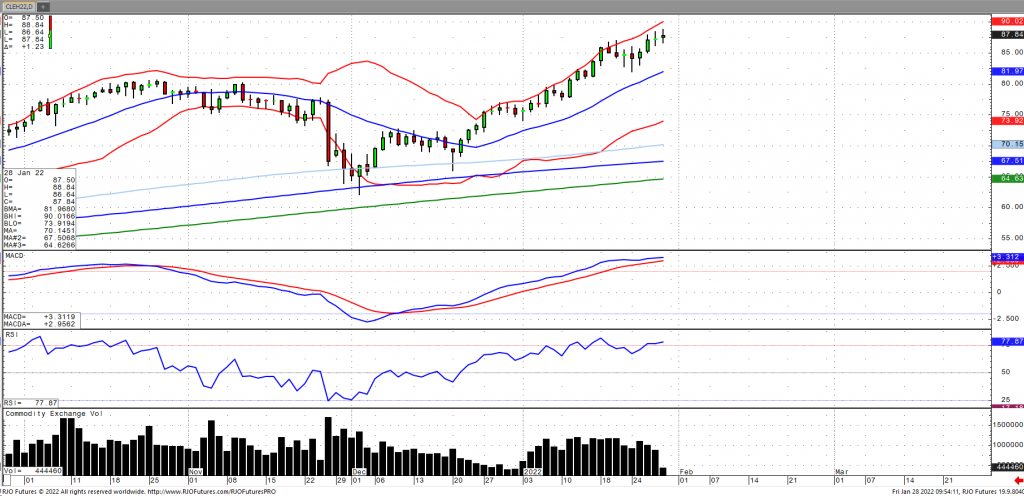
Oil prices have continued to ramp higher and are poised for their sixth consecutive weekly gain as concerns over tight supplies continue amid higher fuel demand. Prices have gained nearly 15% YTD amid geopolitical tensions between Russia and Ukraine as well as threats to the UAE from Yemen’s Houthi movement. This comes as OPEC+ is observed to continue with their existing plan to gradually increase production with the market looking ahead to the upcoming meeting on Feb 2nd. Regarding demand, China, the world’s largest importer, is expected to rebound by around 7% this year, reversing last year’s decline. Crude stocks rose 2.377 million barrels recording the second consecutive build after falling for eight weeks in a row, according to the EIA. The year over year deficit fell -12.107 million barrels to -60.463 million barrels with the five-year average falling to -37.284 million barrels. Oil volatility (ovx) continues to remain elevated and above trend with the market remaining bullish trend with today’s range seen between 80.73 – 87.76.
Crude Oil Mar '22 Daily Chart If you have any questions or would like to discuss the markets further, please feel free to contact me at 800-438-4805 or aturro@rjofutures.com. Softs - Cocoa Futures Show Weakness, but Potential for Fast Recovery
Cocoa Futures Show Weakness, but Potential for Fast Recovery
By: Peter MoosesPosted 01/28/2022
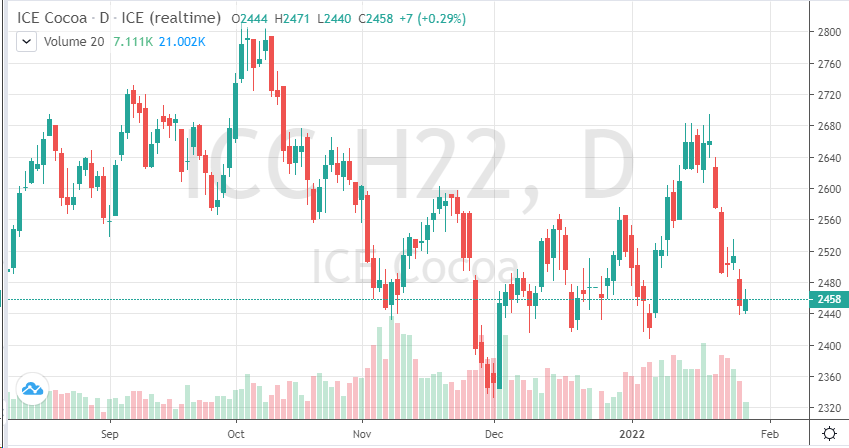
Cocoa
futures have fallen from the highs we saw mid-month. Currencies have played a
major roll in the weakness in cocoa futures. The Euro specifically has
continued to move lower which has carried over to the soft, causing concerns
that the European demand will continue to be low for cocoa.
On
the macro-side, it appears the demand for cocoa is starting to increase. There
are also supply concerns that should provide support and could start a quick
recovery in futures prices. Weather in West Africa is also very dry and hot
which will potentially hurt this year’s crop – causing traders to think that we
move back to 2600.
For now, traders should continue to monitor weather patterns in West Africa. This paired with volatility in the global markets, mixed with demand concerns should create an interesting quarter of trading.
On
the heels of mid-Sep-to-early-Oct's steeper, accelerated, 3rd-wave-looking
recovery, the past week-and-a-half's boringly lateral chop is first considered
a corrective/consolidative event that warns of a continuation of the uptrend
that preceded it to new highs above 04-Oct's 891.0 high. This count
remains consistent with our broader base/correction/recovery count introduced
in 13-Sep's Technical Blog following that
day's bullish divergence in short-term momentum above 07-Sep's 809.5 minor
corrective high detailed in the hourly chart below.
The
important takeaway from this month's lateral, sleepy price action is the
definition of Wed's 851.5 low as
the end or lower boundary of a suspected 4th-Wave correction. A failure
below 851.5 will confirm a bearish divergence in daily momentum and defer or
threaten a bullish count enough to warrant non-bullish decisions like
long-covers. A failure below 851.5 will not
necessarily negate a broader bullish count, but it will threaten it enough to
warrant defensive measures as the next pertinent technical levels below 851.5 are
13-Sep's prospective minor 1st-Wave high at 813.8 and obviously 08-Sep's 766.0
low. And making non-bullish decisions "down there" is
sub-optimal to say the least. Per such, both short- and longer-term
commercial traders are advised to pare or neutralize bullish exposure on a
failure below 851.5, acknowledging and accepting whipsaw risk- back above 04-Oct's
891.0 high- in exchange for much deeper and sub-optimal nominal risk below
766.0.
On
a broader scale, the daily log scale chart above shows the developing potential
for a bearish divergence in daily momentum that will be considered confirmed
below 851.5. This chart also shows the past month's recovery thus far
stalling in the immediate neighborhood of the (888.0) Fibonacci
minimum 38.2% retrace of Apr-Sep's entire 1128 - 766 decline). COMBINED
with a failure below 851.5, traders
would then need to be concerned with at least a larger-degree correction pf the
past month's rally and possibly a resumption of Apr-Sep's major downtrend.
Until
and unless the market fails below 851.5 however, we would
remind longer-term players of the key elements on which our bullish count is
predicated:
a confirmed bullish divergence in WEEKLY momentum
(below)
amidst
an
historically low 11% reading in out RJO Bullish Sentiment Index and
a
textbook complete and major 5-wave Elliott sequence down from 29-Apr's
1128 high to 08-Sep's 766.0 low.
Thus
far, the market is only a month into correcting a 4-MONTH, 32% drawdown, so
further and possibly protracted gains remain well within the bounds of a major
(suspected 2nd-Wave) correction of Apr-Sep's decline within an even more
massive PEAK/reversal process from 17-May's 1219 high on an active continuation
basis below.
These
issues considered, a bullish policy and exposure remain advised with a failure
below 851.5 required to defer or threaten this call enough to warrant moving to
a neutral/sideline position. In lieu of such weakness, we anticipate a
continuation of the past month's rally to new highs and potentially significant
gains above 891.0.
Agricultural - Chi Wheat Poised to Resume Secular Bull Market
Chi Wheat Poised to Resume Secular Bull Market
By: RJO Market InsightsPosted 01/25/2022
While the hourly chart of Globex day-session prices below does not yet reflect overnight's gains that show the market currently trading around 8.12, this performance reinforces a resumed longer-term bullish count introduced in 19-Jan's Technical Webcast following that day's bullish divergence in short-term momentum that provided early evidence that the entire Nov-Jan sell-off attempt from 8.75 to 7.36 was a 3-wave and thus corrective structure. This week's continuation of early-Jan's basing behavior leaves smaller- and larger-degree corrective lows in its wake at 7.75 and 7.36 that this market is now required to relapse below to defer and then negate this resumed bullish count. Per such and importantly, these levels serve as our new short- and longer-term risk parameters from which a resumed and more aggressive bullish policy and exposure can be objectively based and managed.
On
a daily log scale basis above, the extent and impulsiveness of this month's
recovery from 7.36 easily shows the Nov-Jan decline as a 3-wave affair as
labeled. Left unaltered by a relapse below 7.36, this
3-wave event is considered a corrective/consolidative affair that now warns of
a resumption of the secular bull trend shown in the monthly log chart below
that preceded it. Moreover, sustained, trendy, impulsive behavior higher
should not come as a surprise in the period immediately ahead.
If
there's an interim wet blanket on this bullish count, it's the market's
position in the middle of the past couple months' range where we don't want to
underestimate the odds of aimless whipsaw risk typical of such range-center
environs. But herein lies the importance of identifying a tighter but
objective risk parameter like yesterday's 7.75
smaller-degree corrective low. In effect, the bullish bet on a move to
new highs above 8.75 can assume risk only to 7.75. A
relapse below 7.75 won't necessarily negate the long-term bullish count, but it
would defer or threaten it enough to warrant defensive measures. Until
and unless this market fails below at least 7.75, there's
no way to know the trendy, impulsive 5th-Wave to new highs above 8.75 isn't
launching straight away.
These issues considered, traders are advised to move to a new bullish policy and exposure at-the-market (8.13 OB) with a failure below 7.75 required to defer or threaten this call enough to warrant its cover. In lieu of such weakness, further and possibly accelerated gains straight away are anticipated.
Equity - Roller-Coaster Week in Stocks Coming to an End
Roller-Coaster Week in Stocks Coming to an End
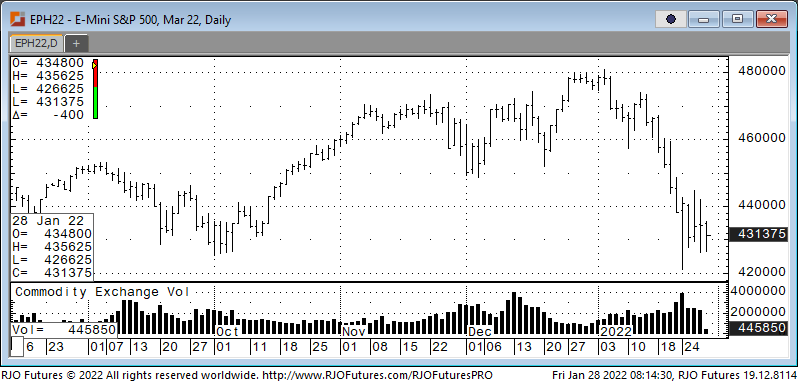
By: Jeff Yasak, Senior Market StrategistPosted Jan 28, 2022 9:59AM CT
Stock futures are trading sharply lower this morning continuing yesterday’s trend. Key economic news this morning was the factor. Personal income rose 0.3% against the expected 0.5% rise. The personal consumption expenditure, the Federal Reserve’s primary inflation measure, rose 0.4% vs. November and 5.8% year over year. Thursday’s losses in the major stock indexes held above Monday’s low which gave hope for week ending rally before the Fed numbers. Earlier this week Jerome Powell, Federal Reserve Chairman, strongly signaled a March increase on interest rates from their near-zero levels. The uncertainty of how quickly they will raise rates and how rapidly they will begin drawing down it’s $9 trillion balance sheet and tightening financial conditions left investors skittish. “Everything the Fed is doing at this point we think has just been priced in over the last few weeks. And that's where a lot of the slide in the market has come from," Morgan Stanley Managing Director Kathy Entwistle told Yahoo Finance Live on Thursday. "And the big question is, will we slide a little bit more? What's happening? We're looking at companies and their earnings ... to determine whether or not we're going to have a little bit more of a pullback in the market or not," she added. "And that's based on what they can do going forward, where their opportunities are. And we've been hearing a lot about inflation. If you think about a 7% inflation rate, that's quite significant."
Support today is checking in at 424200 and 417500 with resistance showing 440300 and 44920.
E-mini S&P 500 Mar '22 Daily Chart If you have any questions or would like to discuss the markets further, please feel free to contact me at 888-861-1656 or jyasak@rjofutures.com. Economy - S-T Mo Failure Insufficient to End RBOB Correction, But Beware
S-T Mo Failure Insufficient to End RBOB Correction, But Beware
By: RJO Market InsightsPosted 11/08/2022
Posted on Nov 08, 2022, 07:51 by Dave Toth
In Fri's Technical Webcast we identified a
minor corrective low at 2.6328 from Thur as a mini risk parameter the market
needed to sustain gains above to maintain a more immediate bullish count.
The 240-min chart below shows the market's failure overnight below this level,
confirming a bearish divergence in very short-term momentum. This mo
failure defines Fri's 2.8172 high as
one of developing importance and a parameter from which very short-term traders
can objectively base non-bullish decisions like long-covers.
Given
the magnitude of the past three weeks' broader recovery however, this
short-term momentum failure is of an insufficient scale to conclude anything
more than another correction within this broader recovery from 26-Sep's 2.1877
low. Indeed, overnights failure below 2.6328 only allows us to conclude
the end of the portion of the month-and-a-half rally from 31-Oct's 2.4822 next
larger-degree corrective low. 2.4822 is the
risk parameter this market still needs to fail below to break the uptrend from
18-Oct's 2.3526 low while this 2.3526 low
remains intact as the risk parameter this market needs to fail below to break
the month-and-a-half uptrend. From an
intermediate-to-longer-term perspective, this week's setback falls well within
the bounds of another correction ahead of further gains. This is another
excellent example of the importance of technical and trading SCALE and
understanding and matching directional risk exposure to one's personal risk
profile.
The
reason overnight's admittedly minor mo failure might have longer-term
importance is the 2.8172-area from which it stemmed. In
Fri's Technical Blog we also noted the market's engagement of the
2.8076-to-2.8159-area marked by the 61.8% retrace of Jun0-Sewp's 3.2758 -2.1877
decline and the 1.000 progression of Sep-Oct's initial 2.1877 - 2.6185
(suspected a-Wave) rally from 18-Oct's 2.3526 (suspected b-Wave) low. We
remind longer-term players that because of the unique and compelling confluence
of:
early-Aug's bearish divergence in WEEKLY momentum
amidst
historically
extreme bullish sentiment/contrary opinion levels in our RJO Bullish
Sentiment Index
an
arguably complete and massive 5-wave Elliott sequence from Mar'20's 0.4605
low to Jun's 4.3260 high (as labeled in the weekly log active-continuation
chart below) and
the
5-wave impulsive sub-division of Jun-Sep's (suspected initial 1st-Wave) decline
The
recovery attempt from 26-Sep's 2.1877 low is arguably only a 3-wave (Wave-2)
corrective rebuttal to Jun-Sep's decline within a massive, multi-quarter
PEAK/reversal process. Now granted, due to the magnitude of 2020 -2022's
secular bull market, we discussed the prospect for this (2nd-Wave corrective)
recovery to be "extensive" in terms of both price and time. A
"more extensive" correction is typified by a retracement of 61.8% or
more and spanning weeks or even months following a 3-month decline. Per
such, the (suspected corrective) recovery from 26-Sep's 2.1877 low could easily
have further to go, with commensurately larger-degree weakness than that
exhibited this week (i.e., a failure below at least 2.4822) required
to consider the correction complete. Indeed, the daily log chart above
shows the market thus far respecting former 2.6185-area resistance from 10-Oct
as a new support candidate.
These
issues considered, very shorter-term traders have been advised to move to a neutral/sideline
position following overnight's momentum failure below 2.6328, with a recovery
above 2.8172 required to negate this call, reaffirm the recovery and re-expose
potentially significant gains thereafter. For intermediate- and
longer-term players, a bullish policy and exposure remain advised with a
failure below 2.4822 required to threaten this call enough to warrant
neutralizing exposure. We will be watchful for another bearish divergence
in momentum following a recovery attempt that falls short of Fri's 2.8172 high
that would be considered the next reinforcing factor to a count calling that
2.8172 high the prospective end to the month-and-a-half 2nd-Wave
correction. In lieu of such, a resumption of the current rally to
eventual new highs above 2.8172 should not surprise.