Profits and Losses: How they both impact on you mentally;
How experienced traders shift their mental approach to overcome their trading obstacles;
How to protect your emotional capital;
The 7 steps to achieving a better trading psychology.
RJO Echo Trading
Attention New or Frustrated Traders:
Do you want to get into futures trading, but don’t have the time or knowledge necessary to do so? RJO Echo Trading is an intuitive way for investors or “echo followers” to automatically match the performance of veteran and accomplished traders. As an “Echo Follower” you will choose from a selection of vetted and experienced “Echo Leaders”, all you have to do is pay a subscription fee and your account will mimic the trades of your chosen “Leader”. Echo Trading eliminates the learning curve needed to trade futures, making it an option for all.
The Markets
Metals - Coronavirus Helping Gold Extend Its Rally
Coronavirus Helping Gold Extend Its Rally
By: Nicholas DeGeorgePosted 01/31/2020
In the early morning trade, April gold has rebounded nicely off its overnight low and continued its rally mostly due to the fear of the coronavirus spreading even more throughout China and certainly slowing down their economy. Furthermore, anxiety on global growth slowing as well as travel due to this situation has helped push gold prices and bonds/notes higher. ETF’s saw their holding rise for the seventh-straight week of inflow putting their holdings to the highest in over 12 months. However, if there is any positive news that comes out of the World Health Organization (WHO) on progress of global containment, then look for a possible big pull back to pre-virus levels.
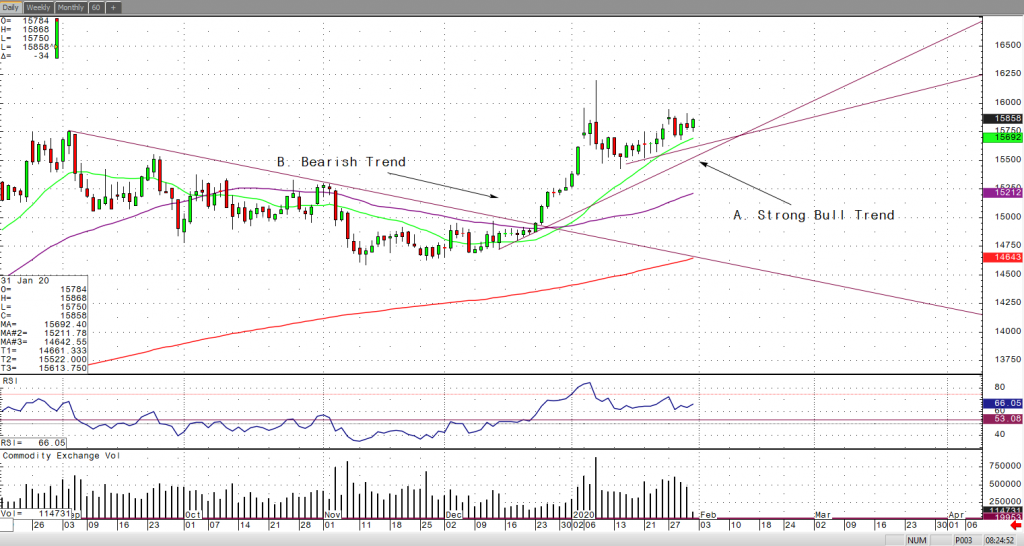
If we take a quick look at the daily April gold chart, you’ll clearly see that after it broke above the down trend on Christmas Eve, the shiny one has been in bullish trend ever since breaking new highs and trying to attack them again. As long as gold stay above $1,542 support, then look for the potential for it to break another contract high becomes more likely.
Gold Mar '20 Daily ChartMetals - Silver Focusing on Global Headlines
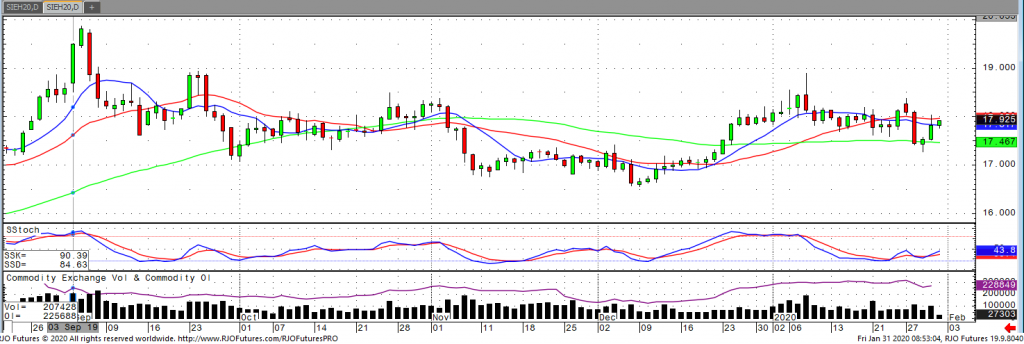
March silver spent the second half of the week fighting its way back from Monday and Tuesday’s move lower. Wednesday we saw a push down to the weekly low of 17.28 before recovering and closing positive on the day. It looks that the market is uncertain on a direction with potential virus/economic developments popping up around the world. This should lead to choppy trade with a slight lean to the upside with any alarming headlines and/or pullbacks in equity markets providing support. The bear side is looking for statements regarding the slowing or containment of the virus or a continued upside push in stocks. The March contract is continuing in a sideways channel and needs to see a push above 17.97 to go test resistance at 18.48. A close under 17.45 would give the bears control and push the market back down to the 17.00 level.
Silver Mar '20 Daily Chart If you have any questions or would like to discuss the markets further, please feel free to contact me at 800-826-2270 or therrmann@rjofutures.com. Energy - Oil Falls on Coronavirus Fears
Oil Falls on Coronavirus Fears
By: Alexander Turro, Senior Market StrategistPosted Jan 31, 2020 7:33AM CT
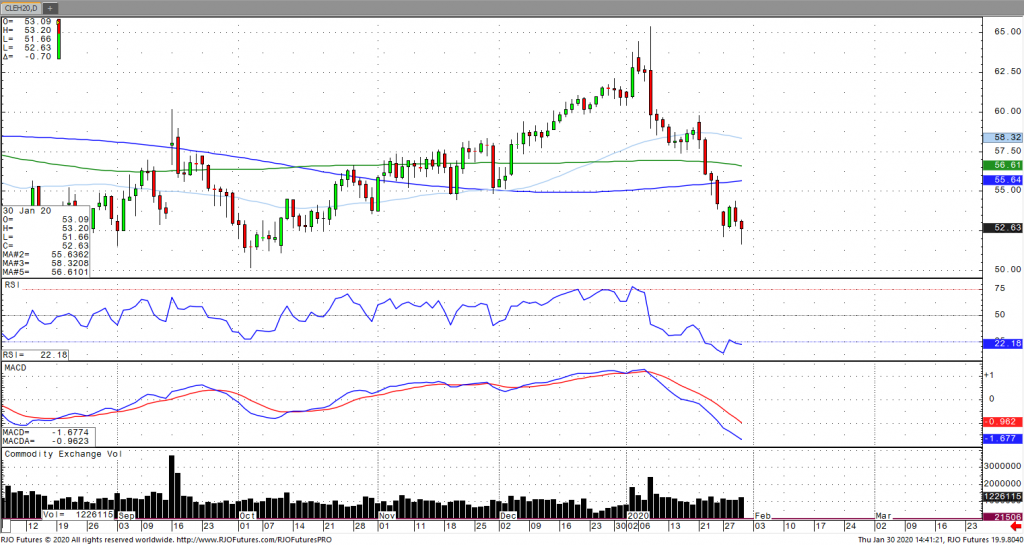
Oil prices took a dive to three-month lows on Thursday before recouping some of the losses as the coronavirus continues to proliferate throughout China and other parts of East Asia, stifling future demand prospects. The World Health Organization labeled the virus a global health emergency Thursday afternoon. Geopolitical risks remain as well as ongoing threats against Middle Eastern supply. Libyan production outages continued this week coupled with reports of Yemeni attacks on Aramco facilities as well as reports that OPEC may be moving up their next scheduled meeting. With the recent decline in price, oil has moved to neutral trend with today’s range seen between 51.26 – 57.62.
Crude Oil Mar '20 Daily Chart If you have any questions or would like to discuss the markets further, please feel free to contact me at 800-438-4805 or aturro@rjofutures.com. Softs - Sugar Seeks to Resume Rally
Sugar Seeks to Resume Rally
By: Eric ScolesPosted 01/29/2020
Mar ’20 sugar futures offered a very bullish signal Tuesday by hammering down taking out previous lows, spiking up taking out previous highs and ultimately closing positive. Wednesday we see sugar prices follow through on this bullish activity pushing prices higher again in what looks like a resumption of the ongoing rally supported by the expected massive global production deficit, and the sell-off we saw likely helps correct concerns of being overbought. At the time of writing, sugar is trading near a resistance point and will need to push higher and close above 14.77 to really prove the rally is back on. It’s possible to see some volatility as China is a major purchaser of this commodity, and like many other markets there is concern over near-term demand from Asia. This is still a very bullish market and my analysis suggests strong fundamentals are still in place and support from rebounding oil prices should be enough to put the sweet sugar ride back on track to more gains.
For a free consultation call my direct line at (312) 373-4875 or send an email to escoles@rjofutures.com.
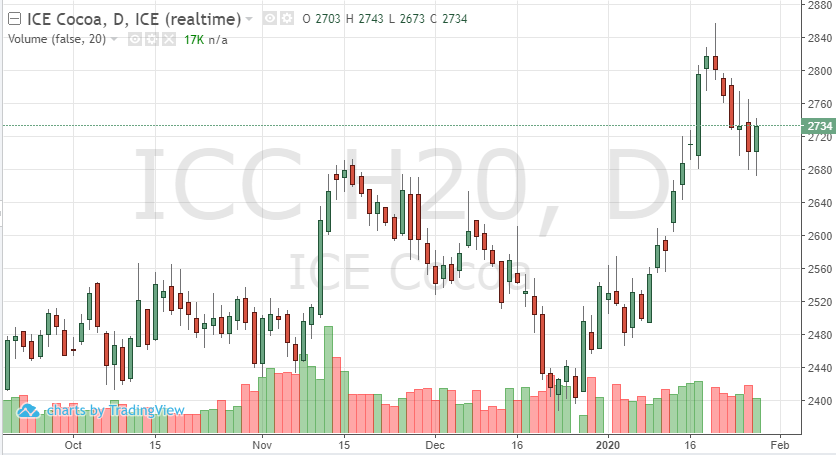
Softs - Cocoa and the Coronavirus
Cocoa and the Coronavirus
By: Peter MoosesPosted 01/30/2020
After cocoa rallied to a contract high, the fundamentals have weakened prices. Trader’s saw a boost in prices due to an increase in demand after last quarter’s grinding numbers. Of late, the global markets have weighed on commodities. Concerns about the coronavirus have affected the equity and futures markets. Asian demand of the soft has come into play. If this virus affects exports in large grinding nations, Asia specifically, we can see prices continue to move lower.
Production
will need to come in lower than expected to give cocoa prices support.
Technically, 2680 is support but the market would need a few more down sessions
to sit there. Demand and coronavirus will guide cocoa over the next week as
more cases and the spread continues.
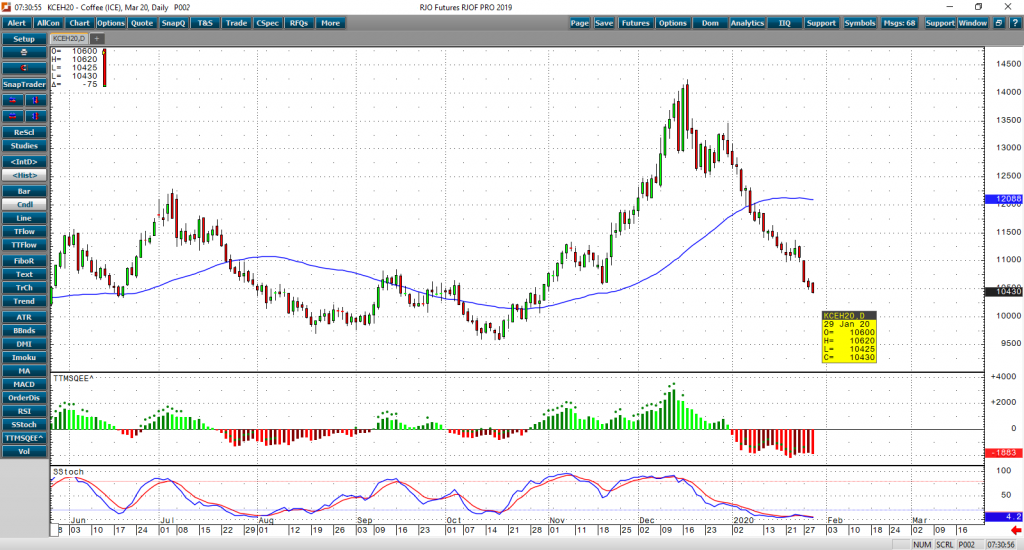
Cocoa Mar '20 Daily ChartSofts - Coffee into Serious Oversold Levels
Coffee into Serious Oversold Levels
By: Adam TuiaanaPosted 01/29/2020
Speaking on the coronavirus, China’s Xi was quoted as saying, “the virus is a devil and we cannot let the devil hide”. Some very realistic concerns have surfaced regarding a widely reduced demand from China due to the ongoing coronavirus, which has easily sparked more continued selling pressure on March coffee prices. Coffee was already suffering some selling pressure due to a large Brazilian supply on the horizon.
Our friends at The Hightower Group shared that “coffee prices are at bargain levels
already, but there is no major fundamental reason for the market to turn
higher.”
For any type of rebound (or even support in the near term), traders must hear some good news in regard to China’s ability to stabilize and slay this “devil”.
From a technical perspective, we have violated the 10580
critical support level and now the 100 level is hoping to hold as somewhat
psychological support. I believe this market to be extremely oversold, and with
the slightest bit of good news related to the coronavirus, it is due for a strong
bounce back.
On
the heels of mid-Sep-to-early-Oct's steeper, accelerated, 3rd-wave-looking
recovery, the past week-and-a-half's boringly lateral chop is first considered
a corrective/consolidative event that warns of a continuation of the uptrend
that preceded it to new highs above 04-Oct's 891.0 high. This count
remains consistent with our broader base/correction/recovery count introduced
in 13-Sep's Technical Blog following that
day's bullish divergence in short-term momentum above 07-Sep's 809.5 minor
corrective high detailed in the hourly chart below.
The
important takeaway from this month's lateral, sleepy price action is the
definition of Wed's 851.5 low as
the end or lower boundary of a suspected 4th-Wave correction. A failure
below 851.5 will confirm a bearish divergence in daily momentum and defer or
threaten a bullish count enough to warrant non-bullish decisions like
long-covers. A failure below 851.5 will not
necessarily negate a broader bullish count, but it will threaten it enough to
warrant defensive measures as the next pertinent technical levels below 851.5 are
13-Sep's prospective minor 1st-Wave high at 813.8 and obviously 08-Sep's 766.0
low. And making non-bullish decisions "down there" is
sub-optimal to say the least. Per such, both short- and longer-term
commercial traders are advised to pare or neutralize bullish exposure on a
failure below 851.5, acknowledging and accepting whipsaw risk- back above 04-Oct's
891.0 high- in exchange for much deeper and sub-optimal nominal risk below
766.0.
On
a broader scale, the daily log scale chart above shows the developing potential
for a bearish divergence in daily momentum that will be considered confirmed
below 851.5. This chart also shows the past month's recovery thus far
stalling in the immediate neighborhood of the (888.0) Fibonacci
minimum 38.2% retrace of Apr-Sep's entire 1128 - 766 decline). COMBINED
with a failure below 851.5, traders
would then need to be concerned with at least a larger-degree correction pf the
past month's rally and possibly a resumption of Apr-Sep's major downtrend.
Until
and unless the market fails below 851.5 however, we would
remind longer-term players of the key elements on which our bullish count is
predicated:
a confirmed bullish divergence in WEEKLY momentum
(below)
amidst
an
historically low 11% reading in out RJO Bullish Sentiment Index and
a
textbook complete and major 5-wave Elliott sequence down from 29-Apr's
1128 high to 08-Sep's 766.0 low.
Thus
far, the market is only a month into correcting a 4-MONTH, 32% drawdown, so
further and possibly protracted gains remain well within the bounds of a major
(suspected 2nd-Wave) correction of Apr-Sep's decline within an even more
massive PEAK/reversal process from 17-May's 1219 high on an active continuation
basis below.
These
issues considered, a bullish policy and exposure remain advised with a failure
below 851.5 required to defer or threaten this call enough to warrant moving to
a neutral/sideline position. In lieu of such weakness, we anticipate a
continuation of the past month's rally to new highs and potentially significant
gains above 891.0.
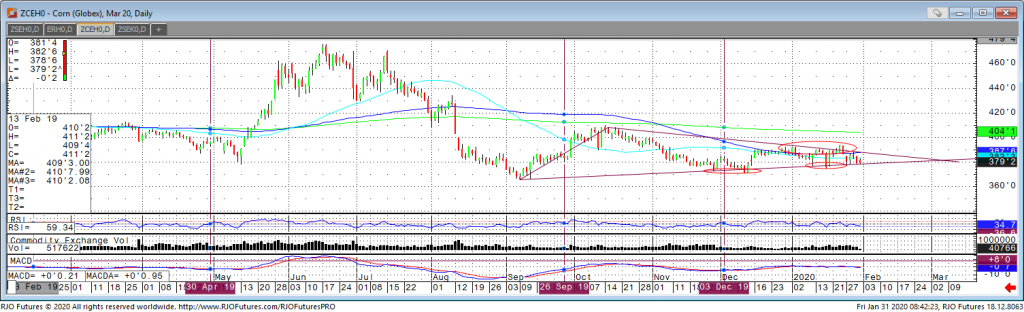
Agricultural - Corn Could Be More Active If Coronavirus is Under Control
Corn Could Be More Active If Coronavirus is Under Control
By: Tony Cholly, Senior Market StrategistPosted Jan 31, 2020 8:48AM CT
There is a sense of relief on virus issues overnight and it is possible that the uncertainties have reached their peak. Coronavirus was the major source of pressure all week long, as there are some doubts that China may not be able to fulfill their side of the trade deal agreement when it comes to purchasing our ag products. Corn prices followed through from Wednesday’s move and had another down day in yesterday’s trading session. Export sales came in at 1,234,700 tonnes for the current marketing year and 143,600 for the next marketing year, for a total of 1,378,300. This was well above trade expectations for sales near 600,000-1.2 million tonnes. Many regions of South America did not receive rains in the week ending January 28th. Precipitation is one thing that can ease the damage of high temperatures. These are still not considered “significant” weather threats right now. Resistance comes in at 382 and 387 while support comes in at 376 and 374.
Corn Mar '20 Daily Chart If you have any questions or would like to discuss the markets further, please feel free to contact me at 800-826-2270 or tcholly@rjofutures.com. Agricultural - Grain Futures Update w/Stephen Davis - 01/31/2020
Grain Futures Update w/Stephen Davis - 01/31/2020
By: Stephen DavisPosted 01/31/2020
There is one thing driving all markets this week and that is the Coronavirus. Stephen talks about how the virus is impacting the grain markets and what he expects in the coming week.
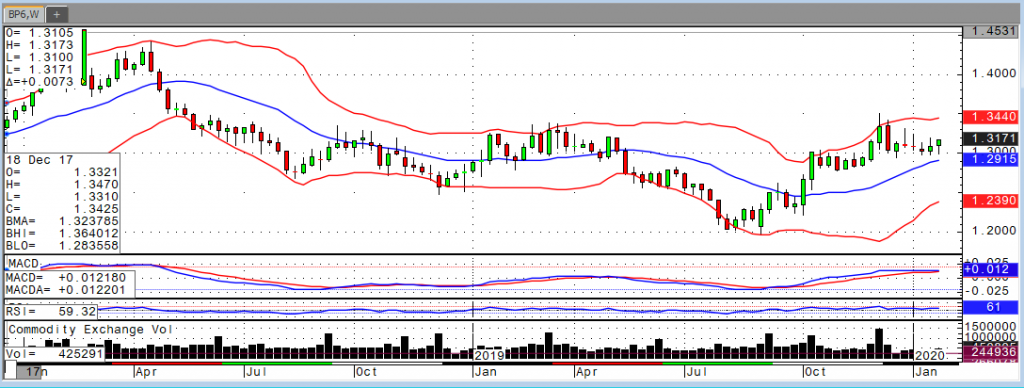
Currency - Dollar Breaks Down as Investors Eye the Pound
Dollar Breaks Down as Investors Eye the Pound
By: Ian BannonPosted 01/31/2020
U.S. dollar futures moved 20 points lower during Thursday’s session, bumping up against resistance at the 98 level earlier in the week and reversing to the downside. Selling continued into Friday’s session, with the dollar index trading along 97.45 during the first hour of pit trading. The FOMC met this week and announced that interest rates would remain unchanged for the time being. However, the developing coronavirus situation is spooking investors, and supporting the idea that the stock market cannot remain at current levels. Should stocks continue lower, there is an increasing probability that the Fed will continue quantitative easing and begin speaking about additional rate cuts. This will serve to weaken the dollar as investors price in more QE. The euro is in a win-by-default situation as the dollar moves lower despite European GDP growing by just 0.1% in the fourth quarter. German GDP is set to be released on February 14th. The British pound continues to look attractive to investors. The official Brexit date is today, January 31st. This situation has caused the pound to remain on the defensive over the past 3 years, and with the Bank of England holding interest rates steady this week, it would appear the pound has bottomed and is positioned to trade higher.
British Pound Mar '20 Daily ChartInterest Rates - 10-Year Note Moves Higher as Fed Concludes Meeting
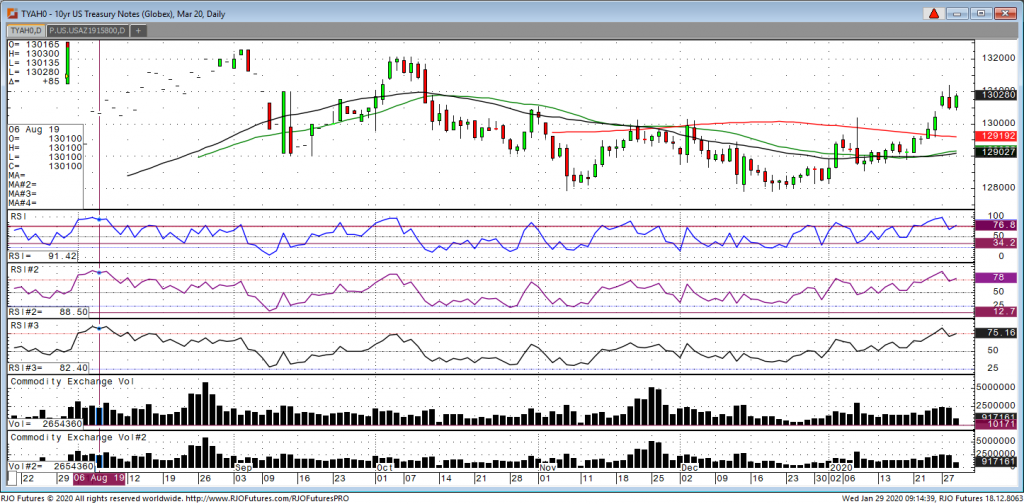
10-Year Note Moves Higher as Fed Concludes Meeting
The March 10-year note has seen an explosive move higher
this week and yields approaching the 1.60 level. The move may be due largely on
the continued Coronavirus headlines as the world waits and watches to see how
exactly this extremely contagious virus spreads and the effects it will have on
the world’s economy.
Another important headline the market is facing happens
later today when the fed concludes a two-day meeting on interest rates. No move is expected but I believe Chairman
Powell will be asked a very important question regarding the plans of the Fed
on continuing to add to the balance sheet.
Since last September, the Fed has added to the balance sheet and some
believe have created a massive bubble of inflated assets. Looking at a technical picture of the 10-year
note we have seen a move above resistance and with many of the retail public
short the notes – this move may have more to go. What’s interesting today, at least on the
open of the stock market at 8:30am, is that both stocks and Treasuries were
both up, but stocks have since turned down on $ Yen weakness
10-Year T-Note Mar '20 Daily Chart If you have any questions or would like to discuss the markets further, please feel free to contact me at 800-826-2270 or gperlin@rjofutures.com. Equity - Stocks Weaker on Coronavirus Fears
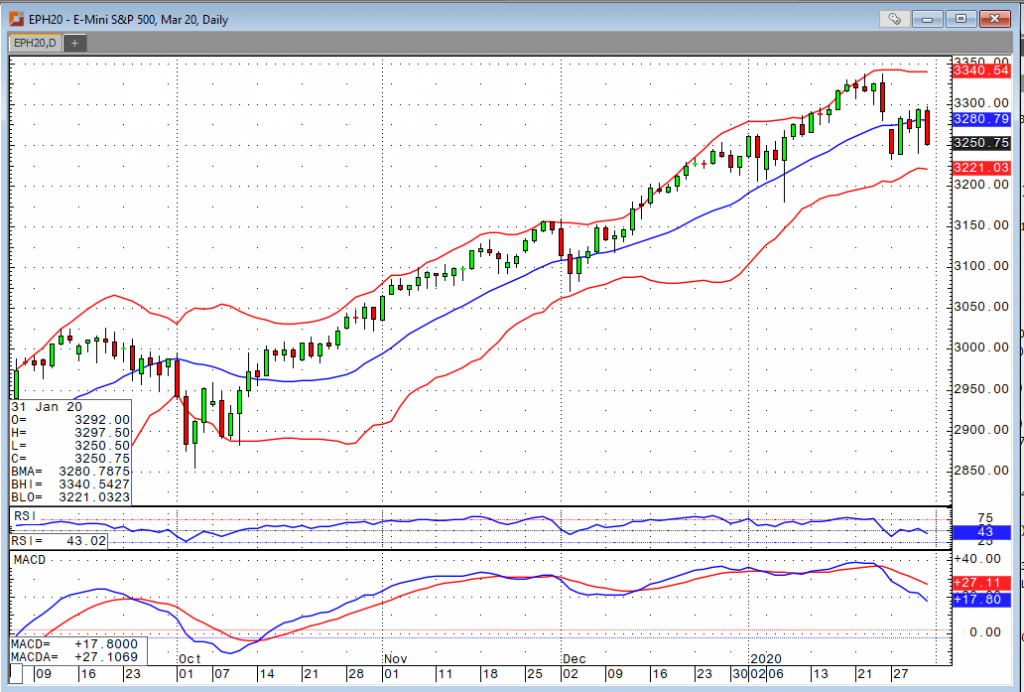
Stocks Weaker on Coronavirus Fears
By: Bill Dixon, Senior Market StrategistPosted Jan 31, 2020 9:47AM CT
After strong closes for the major indices yesterday and blowout earnings from Amazon after the bell, one may have thought we would be seeing some follow through to the upside. The Dow, S&P, Nasdaq, and Russell all managed to briefly eclipse yesterday’s highs in the evening session but were unable to hold the rallies. Shortly after the opening bell, all four are down over one percent already, but they still have a bit of work to do if they’re going to register new lows for the week. The sell-off is being largely attributed to uncertainty regarding the recent outbreak of the coronavirus and how it will impact things moving forward.
Current updates on the Coronavirus indicate we’re now at approximately 200 deaths (all in China) and around 10,000 reported cases worldwide. Here in the United States, we have just six confirmed cases. With confirmed cases now in over twenty countries, the World Health Organization came out yesterday saying the outbreak was a global emergency. They’re suggesting that the virus is highly contagious, and it can take up to two weeks before symptoms are noticed. With that in mind, it seems like it could be a good while before we’re back to business as usual. Participants should monitor the situation closely as this slide is likely to continue in the event the numbers accelerate over the weekend.
E-mini S&P 500 Mar '20 Daily Chart If you have any questions or would like to discuss the markets further, please feel free to contact me at 800-669-5354 or bdixon@rjofutures.com. Economy - S-T Mo Failure Insufficient to End RBOB Correction, But Beware
S-T Mo Failure Insufficient to End RBOB Correction, But Beware
By: RJO Market InsightsPosted 11/08/2022
Posted on Nov 08, 2022, 07:51 by Dave Toth
In Fri's Technical Webcast we identified a
minor corrective low at 2.6328 from Thur as a mini risk parameter the market
needed to sustain gains above to maintain a more immediate bullish count.
The 240-min chart below shows the market's failure overnight below this level,
confirming a bearish divergence in very short-term momentum. This mo
failure defines Fri's 2.8172 high as
one of developing importance and a parameter from which very short-term traders
can objectively base non-bullish decisions like long-covers.
Given
the magnitude of the past three weeks' broader recovery however, this
short-term momentum failure is of an insufficient scale to conclude anything
more than another correction within this broader recovery from 26-Sep's 2.1877
low. Indeed, overnights failure below 2.6328 only allows us to conclude
the end of the portion of the month-and-a-half rally from 31-Oct's 2.4822 next
larger-degree corrective low. 2.4822 is the
risk parameter this market still needs to fail below to break the uptrend from
18-Oct's 2.3526 low while this 2.3526 low
remains intact as the risk parameter this market needs to fail below to break
the month-and-a-half uptrend. From an
intermediate-to-longer-term perspective, this week's setback falls well within
the bounds of another correction ahead of further gains. This is another
excellent example of the importance of technical and trading SCALE and
understanding and matching directional risk exposure to one's personal risk
profile.
The
reason overnight's admittedly minor mo failure might have longer-term
importance is the 2.8172-area from which it stemmed. In
Fri's Technical Blog we also noted the market's engagement of the
2.8076-to-2.8159-area marked by the 61.8% retrace of Jun0-Sewp's 3.2758 -2.1877
decline and the 1.000 progression of Sep-Oct's initial 2.1877 - 2.6185
(suspected a-Wave) rally from 18-Oct's 2.3526 (suspected b-Wave) low. We
remind longer-term players that because of the unique and compelling confluence
of:
early-Aug's bearish divergence in WEEKLY momentum
amidst
historically
extreme bullish sentiment/contrary opinion levels in our RJO Bullish
Sentiment Index
an
arguably complete and massive 5-wave Elliott sequence from Mar'20's 0.4605
low to Jun's 4.3260 high (as labeled in the weekly log active-continuation
chart below) and
the
5-wave impulsive sub-division of Jun-Sep's (suspected initial 1st-Wave) decline
The
recovery attempt from 26-Sep's 2.1877 low is arguably only a 3-wave (Wave-2)
corrective rebuttal to Jun-Sep's decline within a massive, multi-quarter
PEAK/reversal process. Now granted, due to the magnitude of 2020 -2022's
secular bull market, we discussed the prospect for this (2nd-Wave corrective)
recovery to be "extensive" in terms of both price and time. A
"more extensive" correction is typified by a retracement of 61.8% or
more and spanning weeks or even months following a 3-month decline. Per
such, the (suspected corrective) recovery from 26-Sep's 2.1877 low could easily
have further to go, with commensurately larger-degree weakness than that
exhibited this week (i.e., a failure below at least 2.4822) required
to consider the correction complete. Indeed, the daily log chart above
shows the market thus far respecting former 2.6185-area resistance from 10-Oct
as a new support candidate.
These
issues considered, very shorter-term traders have been advised to move to a neutral/sideline
position following overnight's momentum failure below 2.6328, with a recovery
above 2.8172 required to negate this call, reaffirm the recovery and re-expose
potentially significant gains thereafter. For intermediate- and
longer-term players, a bullish policy and exposure remain advised with a
failure below 2.4822 required to threaten this call enough to warrant
neutralizing exposure. We will be watchful for another bearish divergence
in momentum following a recovery attempt that falls short of Fri's 2.8172 high
that would be considered the next reinforcing factor to a count calling that
2.8172 high the prospective end to the month-and-a-half 2nd-Wave
correction. In lieu of such, a resumption of the current rally to
eventual new highs above 2.8172 should not surprise.
Economy - Yields Fall Despite GDP
Yields Fall Despite GDP
By: John Caruso, Senior Market StrategistPosted Jan 30, 2020 11:12AM CT
The Bond market understands what’s happening here.
Yields have crashed to 1.56% this morning even in light of the “Better than
expected” GDP number. On the topic of GDP, how do you have the NY Fed Nowcast
tracking at 1.22% just last week and our nowcast even below that – and pull the
rabbit out of the hat this morning at 2.1% for Q4 2019. It’s being widely
discussed that the Fed massaged or understated the inflation component vs what
they’ve been reporting all quarter and boosted the Net Exports component to
boost Real GDP and keep it above 2% for the quarter. Regardless, another
y/y rate of change slowdown 2.9 (2018) to 2.3 (2019).
The Bond market gets it, the USD is coming off, and Oil
failed to hold our trend line of 52.95 – NOT GOOD. The Fed will have to
go more dovish in the future to combat what the macro market appears to be
front running – our call for Scenario 4 (Growth and Inflation decelerating) in
Q2 2020. It’s happening now. We know this, and we’ll trade
accordingly going forward.
The British Pound is off to the races. Along with our
call in Gold, Bonds and USD, the British Pound might be our highest conviction
call going forward in the currency space. The BOE met today and held
interested rates steady, however downgraded their growth outlook.
Interesting enough, the last major data points out of the UK were
positive. We saw an acceleration in both their employment data as well as
their PMI data. With tomorrow being the official Brexit Day in the UK, we
think the economic backdrop is becoming less ambiguous since the onset of
Brexit 3yrs ago, and foreign investment will steadily be coming back to the UK
creating higher demand for the Sterling. Cheerio!
10-Year T-Note Mar '20 Daily Chart If you have any questions or would like to discuss the markets further, please feel free to contact me at 800-669-5354 or jcaruso@rjofutures.com.