How technical analysis differs from trading strategy
Why is price action so important
How to implement a trading strategy
RJO Echo Trading
Attention New or Frustrated Traders:
Do you want to get into futures trading, but don’t have the time or knowledge necessary to do so? RJO Echo Trading is an intuitive way for investors or “echo followers” to automatically match the performance of veteran and accomplished traders. As an “Echo Follower” you will choose from a selection of vetted and experienced “Echo Leaders”, all you have to do is pay a subscription fee and your account will mimic the trades of your chosen “Leader”. Echo Trading eliminates the learning curve needed to trade futures, making it an option for all.
The Markets
Metals - Gold Trying to Rally Back Above $1,600
Gold Trying to Rally Back Above $1,600
By: Nicholas DeGeorgePosted 02/14/2020
In the early morning trade, gold has extended on its rally
which started last week at $1,555 and is currently trading at $1,579, which is
up 1.5% in a week. Obviously, the coronavirus is the driving force of the
recent gold rally while it provides fear and concern in the metals and interest
rate sectors, which has caused buying from investors/traders alike. Also, the
shiny one has expectations that China will eventually release a massive
stimulus package after the virus subdues. Furthermore, ETFs saw a 17th
straight day of inflow.
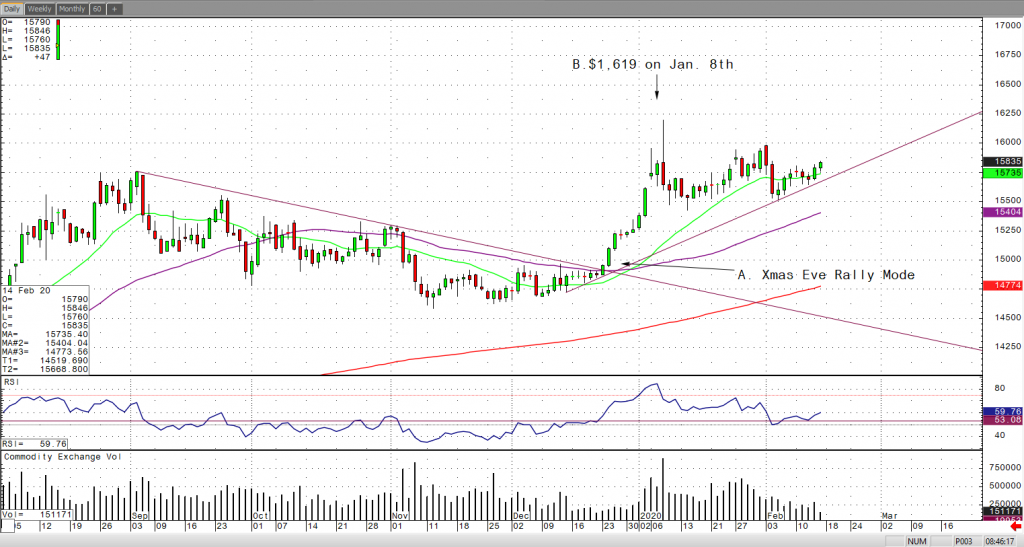
If you take a look at the April gold chart, you’ll clearly see that the gold bulls have taken over on Christmas Eve and have been in control ever since. It is in a strong bull trend and looks like it wants to retest the contract high of $1619.6 which was made back on January 8th. I have highlighted these levels below on my RJO Pro daily April gold candle stick chart.
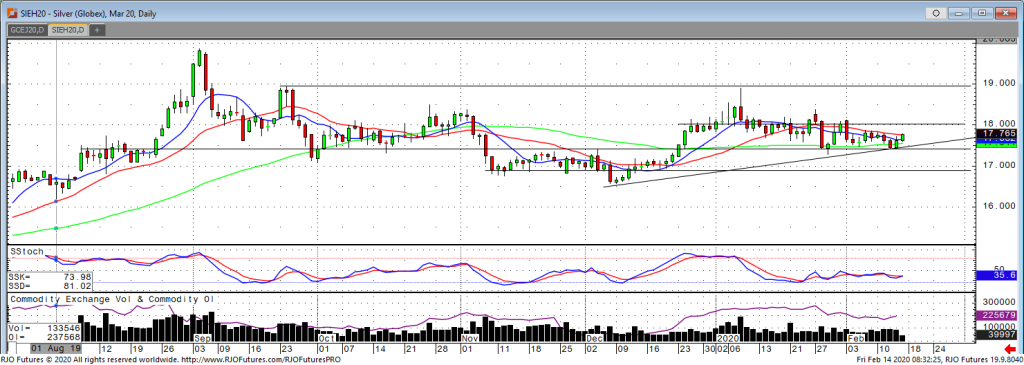
The March silver market has continued the sideways pattern it has been in for the past month and a half, trading as low as 17.435 mid-week before finishing with a positive day Thursday and a positive start to Friday’s session. The virus talks, and growing cases of infection remain at the forefront of the headlines this week, but the silver market has managed to stay relatively calm. Moves to the upside have been limited by expectations that China will release a stimulus package to prop up its economy. With this recent coiling in the market, as long as support of 17.41 holds there is potential for a push higher and a retest of resistance at 18.00. A close above that first resistance level would see a trend higher with 18.445 and 19.00 as the next upside targets. To have this happen we would need to most likely see a correction in the stock market and/or headlines of an accelerated spread of the virus. A break below support of 17.41 would turn the short-term trend lower with the next support level at 17.00 and 16.535.
Silver Mar '20 Daily Chart If you have any questions or would like to discuss the markets further, please feel free to contact me at 800-826-2270 or therrmann@rjofutures.com. Energy - Oil on Pace for First Weekly Rise in 6-Weeks
Oil on Pace for First Weekly Rise in 6-Weeks
By: Alexander Turro, Senior Market StrategistPosted Feb 14, 2020 8:28AM CT
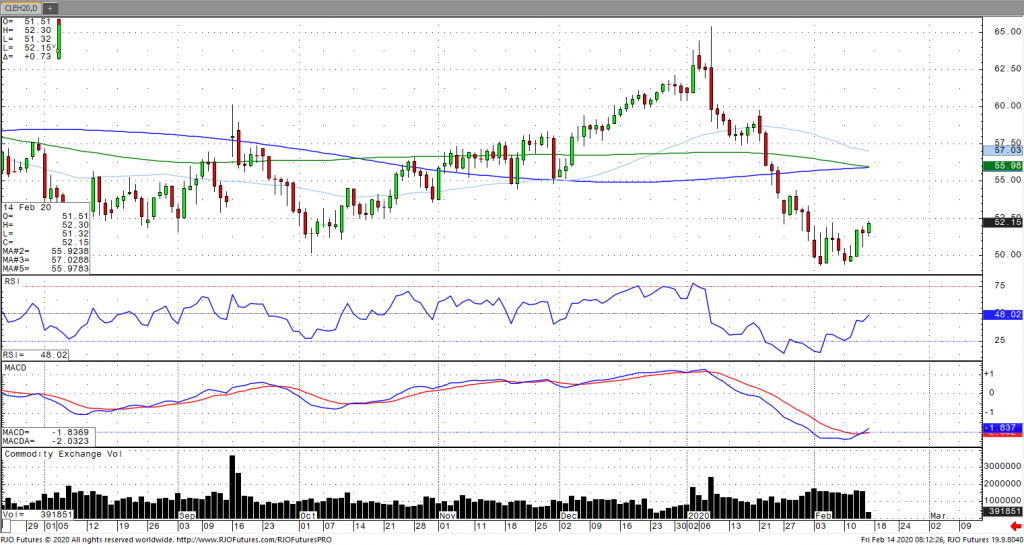
Oil has rallied to a near two-week high despite plunging
more than 16% this year amid optimism from the World Health Organization (WHO)
that the threat of the coronavirus may be abating. This comes as the WHO reported
that the sudden surge in diagnoses does not necessarily imply a surge in new
infections. In addition, the International Energy Agency (IEA) revised first
quarter demand prospects as well a decline in January OPEC production from
29.44 million barrels per day to 28.86 million barrels per day, which would be
the first quarterly contraction in more than ten years. This is coupled with
OPEC downgrading their demand growth prospects this year for the sixth time in
nine months, this time by 230k to 990k barrels per day, while simultaneously lowering
their global economic forecast to 3% this year. OPEC is next scheduled to meet
March 5 -6 with deeper cuts likely. Do
not discount geopolitical risk factors. The market remains bearish trend with
today’s range seen between 49.05 - 52.70.
Crude Oil Mar '20 Daily Chart If you have any questions or would like to discuss the markets further, please feel free to contact me at 800-438-4805 or aturro@rjofutures.com. Softs - Tug-of-War Between Supply and Demand in Cocoa Futures
Tug-of-War Between Supply and Demand in Cocoa Futures
By: Peter MoosesPosted 02/13/2020
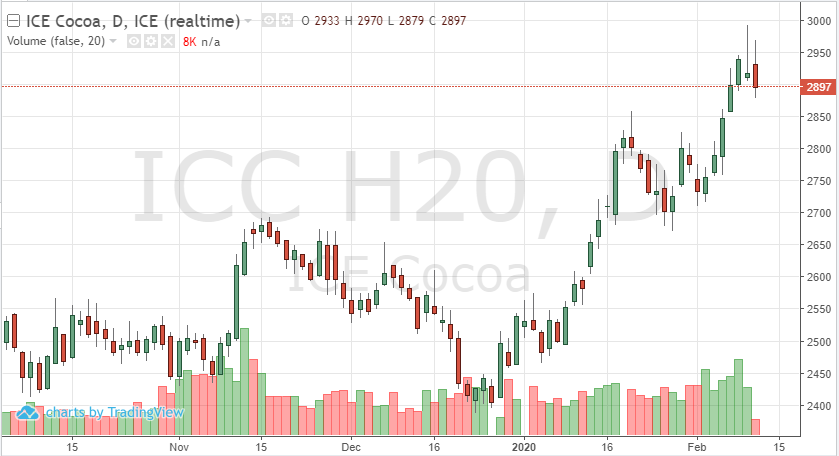
March
cocoa futures hit a multiyear high last week as the market attempted to touch
3000. The supply side of the fundamental equation is bullish. Weather premium
is in prices due to patterns in West Africa. Harmattan winds tend to affect the
crop this time of year, this mixed with the dry season coming to an end, could
see production data down. These factors have provided support for the traders
who are long.
The
weakness and uncertainty in demand has not allowed prices to cross 3000. If
demand were to increase, 3200 is attainable. Asian grinding data will be a good
indicator moving forward. With the Coronavirus and that region of the world not
functioning normally (with imports and exports mainly), how long the market
will be negativity impacted by the virus is anyone’s guess.
Technically in the short-term a close above 2915 is needed to reaffirm the move higher. If these current levels fail, a drop back down to 2850 isn’t too far-fetched. The COT data being released Friday after the close will show us if we are in store for some more long liquidation.
Cocoa Mar '20 Daily ChartSofts - Good Buying Opportunity in Coffee?
Good Buying Opportunity in Coffee?
By: Adam TuiaanaPosted 02/12/2020
Although May coffee has had an impressive three
consecutive days of positive price action, we are still far from having the
supply demand support news that is required to rally back to the 108 level. Last
week’s bullish roar comes mostly on the heels of short covering. May coffee is
still dwelling at seriously oversold levels, but the fact that prices have been
able to hold support at the 100 level, and also not challenge the October low
of 9815, should indicate a potential for consolidation in the near term.
Our friends at The Hightower Group shared that “Brazil should still have a sizable
production increase from the 2019/20 season, but leaf rush and berry borer
issues make it less likely that it will reach a record high total.” For any
type of rebound (or even support in the near term), traders must hear some good
news in regard to China’s ability to stabilize the coronavirus so that more
risk capital can make its way to coffee, as I believe it to be a great buying
levels at this point.
From a technical perspective, we have been able to hold support at the 100 level and now the 102 level looks to be near term support. I believe this market to be extremely oversold, and with the slightest bit of good news related to not only the coronavirus, but key supply side issues, it could be due for an extremely strong bounce back.
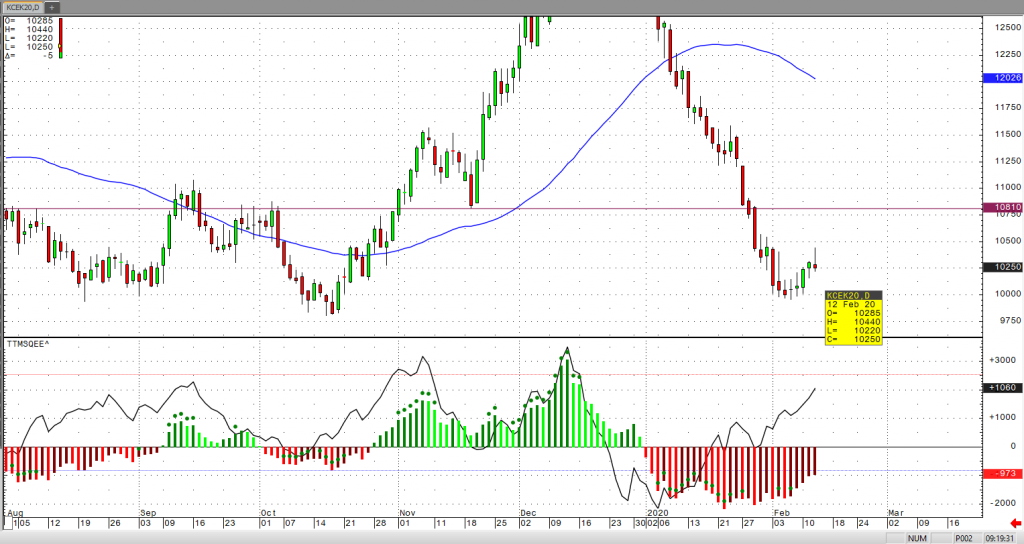
On
the heels of mid-Sep-to-early-Oct's steeper, accelerated, 3rd-wave-looking
recovery, the past week-and-a-half's boringly lateral chop is first considered
a corrective/consolidative event that warns of a continuation of the uptrend
that preceded it to new highs above 04-Oct's 891.0 high. This count
remains consistent with our broader base/correction/recovery count introduced
in 13-Sep's Technical Blog following that
day's bullish divergence in short-term momentum above 07-Sep's 809.5 minor
corrective high detailed in the hourly chart below.
The
important takeaway from this month's lateral, sleepy price action is the
definition of Wed's 851.5 low as
the end or lower boundary of a suspected 4th-Wave correction. A failure
below 851.5 will confirm a bearish divergence in daily momentum and defer or
threaten a bullish count enough to warrant non-bullish decisions like
long-covers. A failure below 851.5 will not
necessarily negate a broader bullish count, but it will threaten it enough to
warrant defensive measures as the next pertinent technical levels below 851.5 are
13-Sep's prospective minor 1st-Wave high at 813.8 and obviously 08-Sep's 766.0
low. And making non-bullish decisions "down there" is
sub-optimal to say the least. Per such, both short- and longer-term
commercial traders are advised to pare or neutralize bullish exposure on a
failure below 851.5, acknowledging and accepting whipsaw risk- back above 04-Oct's
891.0 high- in exchange for much deeper and sub-optimal nominal risk below
766.0.
On
a broader scale, the daily log scale chart above shows the developing potential
for a bearish divergence in daily momentum that will be considered confirmed
below 851.5. This chart also shows the past month's recovery thus far
stalling in the immediate neighborhood of the (888.0) Fibonacci
minimum 38.2% retrace of Apr-Sep's entire 1128 - 766 decline). COMBINED
with a failure below 851.5, traders
would then need to be concerned with at least a larger-degree correction pf the
past month's rally and possibly a resumption of Apr-Sep's major downtrend.
Until
and unless the market fails below 851.5 however, we would
remind longer-term players of the key elements on which our bullish count is
predicated:
a confirmed bullish divergence in WEEKLY momentum
(below)
amidst
an
historically low 11% reading in out RJO Bullish Sentiment Index and
a
textbook complete and major 5-wave Elliott sequence down from 29-Apr's
1128 high to 08-Sep's 766.0 low.
Thus
far, the market is only a month into correcting a 4-MONTH, 32% drawdown, so
further and possibly protracted gains remain well within the bounds of a major
(suspected 2nd-Wave) correction of Apr-Sep's decline within an even more
massive PEAK/reversal process from 17-May's 1219 high on an active continuation
basis below.
These
issues considered, a bullish policy and exposure remain advised with a failure
below 851.5 required to defer or threaten this call enough to warrant moving to
a neutral/sideline position. In lieu of such weakness, we anticipate a
continuation of the past month's rally to new highs and potentially significant
gains above 891.0.
Agricultural - Grain Futures Update w/Stephen Davis - 02/14/2020
Grain Futures Update w/Stephen Davis - 02/14/2020
By: Stephen DavisPosted 02/14/2020
Stephen Davis discusses this week's movements in the grain markets. Coronavirus is still affecting both foreign and domestic grain markets. China is experience a food shortage and is supposed to start buying U.S. grains as part of the Phase One Trade Deal. Now, if that happens remains to be seen, but it could be huge for U.S. grains.
Agricultural - Demand in Corn Improving, but is it Enough?
Demand in Corn Improving, but is it Enough?
By: Tony Cholly, Senior Market StrategistPosted Feb 14, 2020 9:22AM CT
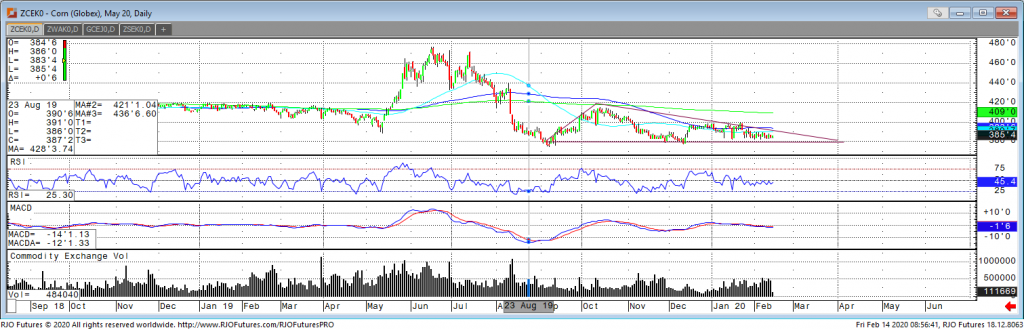
Corn prices continue to coil up in this wedge pattern that is forming on the charts. The increase in coronavirus cases in Hubei provinces weighed on the corn market as that cast fresh doubt on whether China can meet their target of U.S. corn and DDG purchases. There is rain in the forecast for South America growing regions, particularly for Argentina next week. This will also weigh on prices. Buenos Aires Grain Exchange did lower their forecast for argentine 2019/2020 production from 50-million tonnes down to 49-million tonnes. Sales will need to average 675,000 tonnes per week to reach the USDA forecast. Hubei, the province at the center of the epidemic, reported almost 15,000 new cases after revising the way they diagnose the virus, which undercuts the idea that the virus was slowing. Cash basis is better than normal and bull-spreading is also helping support the market. Per usual, demand concerns remain the big story in corn. The next area of resistance is around 381 and 383 with support at 377 and 376.
Corn May '20 Daily Chart If you have any questions or would like to discuss the markets further, please feel free to contact me at 800-826-2270 or tcholly@rjofutures.com. Currency - British Pound and U.S. Dollar Move Higher as the Euro Weakens
British Pound and U.S. Dollar Move Higher as the Euro Weakens
By: Ian BannonPosted 02/14/2020
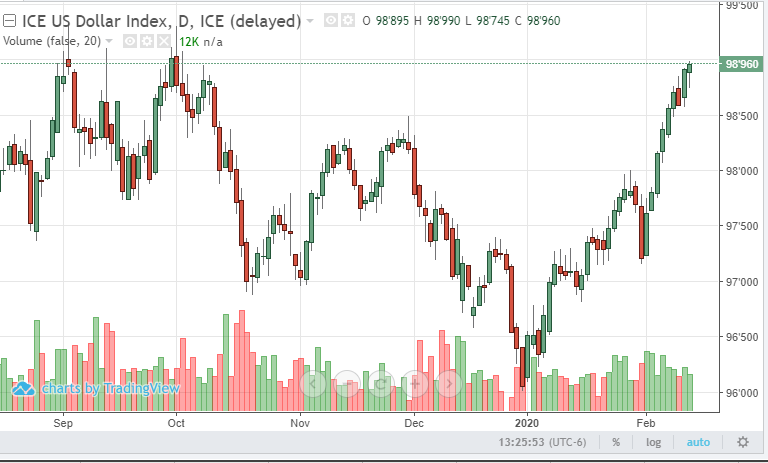
– U.S. dollar futures are higher yet again on Thursday afternoon, attempting to make a run over the 99 level to test the October high @ 99.305. Economic anxiety caused safe-haven buying in the dollar index as the coronavirus situation in China has gone from better to worse this week. After experimenting with new forms of detection, such as CT scans and ribonucleic-acid tests, there was a surge of over 14,000 additional cases coming out of the Hubei province alone. Side effects of the evolving virus situation include a slowdown in economic activity, so investors are looking toward the relatively strong U.S. economy for safe-keeping.
Furthermore, U.S. stock markets remain overvalued, so as investors move their money to the sidelines, cash markets aka the U.S. dollar will see strength. Meanwhile, the euro is in the grips of the ‘falling knife’ pattern on the charts. Trading at levels not seen since 2017, the euro moved as low as 1.0852 on Thursday with no signs of support. On the contrary, the British pound is holding up in the face of a stronger greenback. The currency of the UK is 0.71% higher on increased volume during Thursday’s trade. Technical projections signal more upside is to come. The Japanese yen stays depressed. This is not surprising in the face of a strong equity market. Should we see a stock market sell-off, yen futures are likely to move higher. Commodity currencies, like the Canadian and Australian dollar, remain in a short-term bearish pattern.
U.S. Dollar Daily ChartInterest Rates - U.S. Treasuries Feeling Pressure
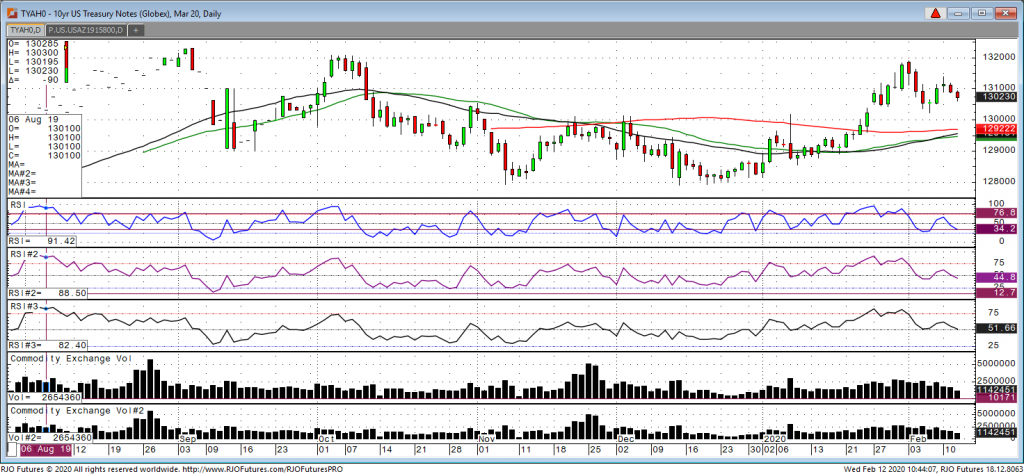
Coming into this morning, we see the March note trading down
11 ticks at 130.21 with a range of 130.30- 130.19.5. The market was still
acting friendly with the note yesterday and not far from the 1.50 yield. Powell
just finished his testimony and with not much market movement and stocks having
a good day, we are seeing some pressure on the treasuries. I am still in the
bull camp because of the coronavirus and how it impacts the Chinese economy
going forward. My best guess is we will see a substantial slowdown in China
which could have a major effect on our economy in the coming months. Today we have some Fed speakers and a ten-year
auction at noon.
Let’s take a look at technicals for the ten-year note. The market is still in a bullish trend, needing to hold 130-12 on a closing basis for the uptrend to continue. If this price holds, expect a move to 131.16 to come in to the cards rather quickly. If we break 130-12, we could see a move to 130-02 in quick order. Traders should be cognizant if any new developments come out on the Coronavirus as that should be a catalysis for the next move.
10-Year Note Mar '20 Daily Chart If you have any questions or would like to discuss the markets further, please feel free to contact me at 800-826-2270 or gperlin@rjofutures.com. Equity - U.S. Stock Market Remains Resilient in the Face of Coronavirus Uncertainty
U.S. Stock Market Remains Resilient in the Face of Coronavirus Uncertainty
By: Ian BannonPosted 02/14/2020
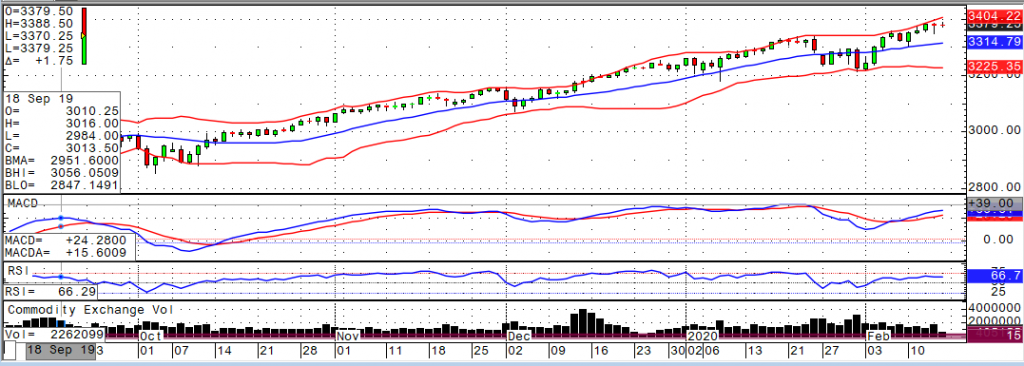
U.S. stock indices are bumping up against resistance into week’s end as uncertainty surrounding the coronavirus situation continues. The March e-mini S&P is 58 points higher on the week but has struggled at the 3380 level during Thursday and Friday’s trade. Furthermore, implied volatility is at -5%, indicating levels of complacency are still high in the stock market at a time when the VIX remains elevated above 15.00. This tells me that funds are hedging while they are still mindlessly piling into an overvalued stock market. Gold prices and interest rates would support this hypothesis. Going into a three-day weekend, I would be weary about long exposure at these levels given the elevation in coronavirus cases in Hubei this week. However, adding fuel to the bull camp is the confidence that investors have in aggressive central bank support. Should U.S. stock observe a 3-5% correction, the Fed is likely to step in and speak about further rates cuts and quantitative easing. Support in the March S&P is seen at 3356 and below there at 3314.50. The Russell 2000 remains the weakest of the main indices.
E-Mini SP 500 Mar '20 Daily ChartEconomy - S-T Mo Failure Insufficient to End RBOB Correction, But Beware
S-T Mo Failure Insufficient to End RBOB Correction, But Beware
By: RJO Market InsightsPosted 11/08/2022
Posted on Nov 08, 2022, 07:51 by Dave Toth
In Fri's Technical Webcast we identified a
minor corrective low at 2.6328 from Thur as a mini risk parameter the market
needed to sustain gains above to maintain a more immediate bullish count.
The 240-min chart below shows the market's failure overnight below this level,
confirming a bearish divergence in very short-term momentum. This mo
failure defines Fri's 2.8172 high as
one of developing importance and a parameter from which very short-term traders
can objectively base non-bullish decisions like long-covers.
Given
the magnitude of the past three weeks' broader recovery however, this
short-term momentum failure is of an insufficient scale to conclude anything
more than another correction within this broader recovery from 26-Sep's 2.1877
low. Indeed, overnights failure below 2.6328 only allows us to conclude
the end of the portion of the month-and-a-half rally from 31-Oct's 2.4822 next
larger-degree corrective low. 2.4822 is the
risk parameter this market still needs to fail below to break the uptrend from
18-Oct's 2.3526 low while this 2.3526 low
remains intact as the risk parameter this market needs to fail below to break
the month-and-a-half uptrend. From an
intermediate-to-longer-term perspective, this week's setback falls well within
the bounds of another correction ahead of further gains. This is another
excellent example of the importance of technical and trading SCALE and
understanding and matching directional risk exposure to one's personal risk
profile.
The
reason overnight's admittedly minor mo failure might have longer-term
importance is the 2.8172-area from which it stemmed. In
Fri's Technical Blog we also noted the market's engagement of the
2.8076-to-2.8159-area marked by the 61.8% retrace of Jun0-Sewp's 3.2758 -2.1877
decline and the 1.000 progression of Sep-Oct's initial 2.1877 - 2.6185
(suspected a-Wave) rally from 18-Oct's 2.3526 (suspected b-Wave) low. We
remind longer-term players that because of the unique and compelling confluence
of:
early-Aug's bearish divergence in WEEKLY momentum
amidst
historically
extreme bullish sentiment/contrary opinion levels in our RJO Bullish
Sentiment Index
an
arguably complete and massive 5-wave Elliott sequence from Mar'20's 0.4605
low to Jun's 4.3260 high (as labeled in the weekly log active-continuation
chart below) and
the
5-wave impulsive sub-division of Jun-Sep's (suspected initial 1st-Wave) decline
The
recovery attempt from 26-Sep's 2.1877 low is arguably only a 3-wave (Wave-2)
corrective rebuttal to Jun-Sep's decline within a massive, multi-quarter
PEAK/reversal process. Now granted, due to the magnitude of 2020 -2022's
secular bull market, we discussed the prospect for this (2nd-Wave corrective)
recovery to be "extensive" in terms of both price and time. A
"more extensive" correction is typified by a retracement of 61.8% or
more and spanning weeks or even months following a 3-month decline. Per
such, the (suspected corrective) recovery from 26-Sep's 2.1877 low could easily
have further to go, with commensurately larger-degree weakness than that
exhibited this week (i.e., a failure below at least 2.4822) required
to consider the correction complete. Indeed, the daily log chart above
shows the market thus far respecting former 2.6185-area resistance from 10-Oct
as a new support candidate.
These
issues considered, very shorter-term traders have been advised to move to a neutral/sideline
position following overnight's momentum failure below 2.6328, with a recovery
above 2.8172 required to negate this call, reaffirm the recovery and re-expose
potentially significant gains thereafter. For intermediate- and
longer-term players, a bullish policy and exposure remain advised with a
failure below 2.4822 required to threaten this call enough to warrant
neutralizing exposure. We will be watchful for another bearish divergence
in momentum following a recovery attempt that falls short of Fri's 2.8172 high
that would be considered the next reinforcing factor to a count calling that
2.8172 high the prospective end to the month-and-a-half 2nd-Wave
correction. In lieu of such, a resumption of the current rally to
eventual new highs above 2.8172 should not surprise.