Discover how options are priced and learn to read option quotes
How to trade rising and falling markets using options
The Markets
Metals - Get Your Popcorn Ready with Gold
Get Your Popcorn Ready with Gold
By: Nicholas DeGeorgePosted 08/23/2019
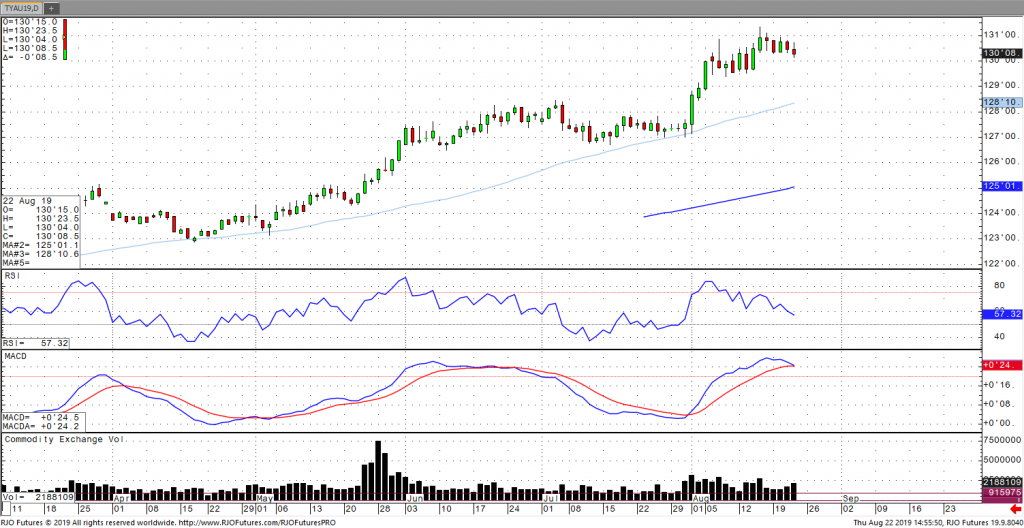
In the early morning trade, October gold is slightly up
trading at $1,508 an ounce and trading near six-year highs. Surprisingly, when
China announced this morning that starting on September 1st they
would start taxing U.S. crude oil imports by 5%, gold didn’t catch an immediate
bid off that news. However, Fed chairman Jerome Powell is making remarks
shortly from Jackson Hole as the markets wait patiently to see how aggressively
he will guide on interest rate cuts, which are expected to happen in September
at 25 basis points.
If we look at the daily October Gold chart, you’ll clearly see the strong bull market that the shiny one has enjoyed since late spring/early summer. There is strong support between $1,485-$1,450, so watch for the bulls to buy on pull backs in this area. The August high of $1,539.5 will be a key resistance area and if the market can get above that level and with all the uncertainty going on currently, which is mostly being caused by the media, then we can’t rule out a rally up to $1,600-$1,700 an ounce by the end of the year, which many professionals are predicting, but they are also quit often wrong. We’ll just have to wait and see, but as pro football HOF Terrell Owens says, “Get Your Popcorn Ready”.
Metals - Silver Futures, Looking for Some Direction
Silver Futures, Looking for Some Direction
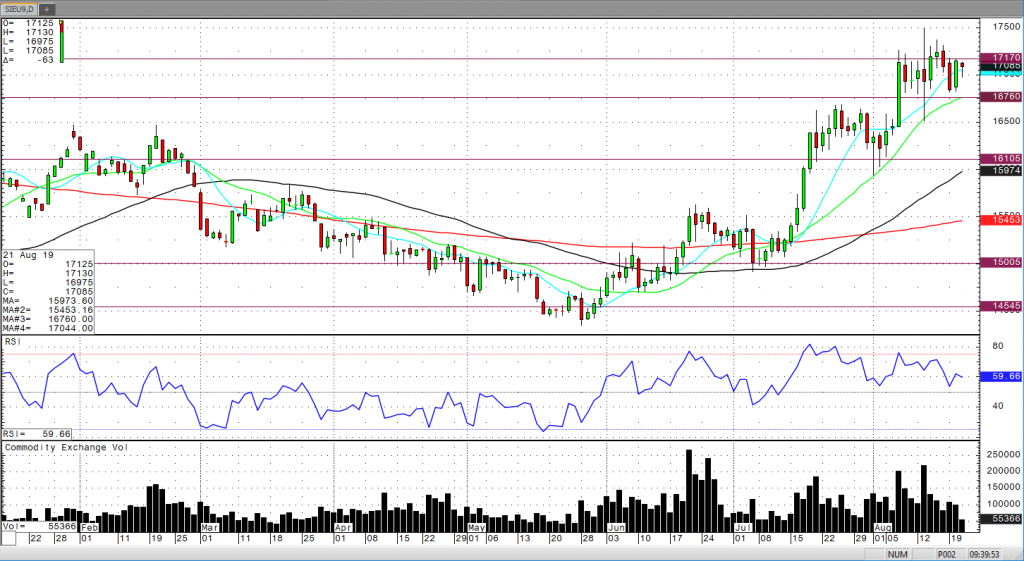
By: Frank J. Cholly, Senior Market StrategistPosted Aug 21, 2019 9:56AM CT
The silver futures market is in a consolidation mode. A
choppy, sideways trading range between $16.80 and $17.25…roughly. This is where
the market finds value until we get some direction from the Fed or the economic
data. This holding pattern is still a bullish pattern. Likely just a pause
before the next leg up towards the recent spike high at $17.50 and then off
towards $18.00! But you know how it goes, a bull market needs to be fed a
steady flow of bullish news. Additional rate cuts would be bullish for metals.
The only confusion or question now comes from “what will the
Fed do”? The U.S. economy is doing pretty good and the “data” supports this
statement. So, does our economy need more easy money stimulus? The answer in my
opinion is no! Herein lies the problem. The global economy’s health relies
heavily on the strength of the U.S. economy. We must keep our economy strong
enough to lift or at least lend some support to most of the globe.
That is why I believe that the Fed will continue to reduce rates. That is where the silver market will get its catalyst to move towards $18.00. The Fed’s decision to cut rates again will give upward direction to precious metals.
Silver Sep '19 Daily Chart If you have any questions or would like to discuss the markets further, please feel free to contact me at 800-826-4124 or fcholly@rjofutures.com. Energy - Crude Oil Approaching Daily Averages
Crude Oil Approaching Daily Averages
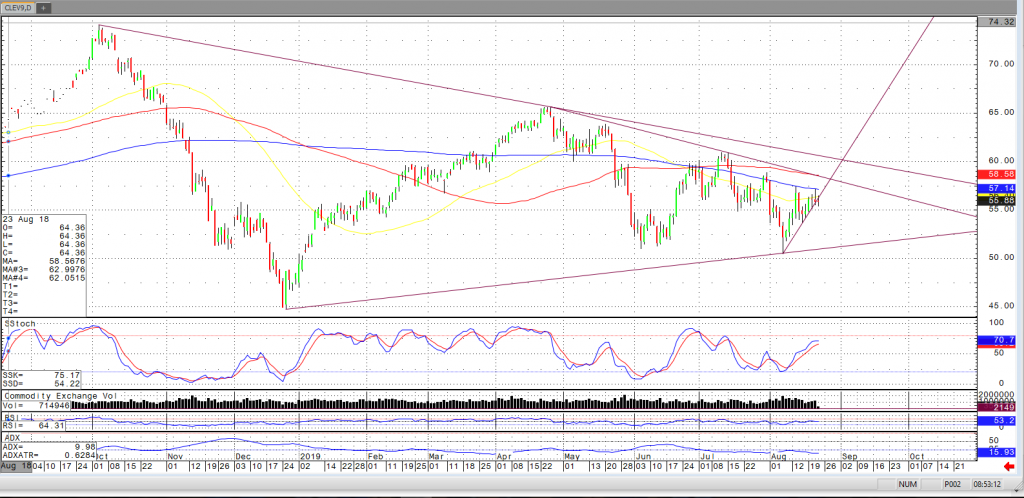
By: Michael O'DonnellPosted 08/22/2019
Thursday morning’s trading has the October 2019 Crude oil
contract trading near $56.18, up $0.50 on the day as the market continues its
strength since the August 7th low. The market is also approaching
the 50, 100, and 200-day moving averages and traders may note if these act as
resistance or support in the near future.
The market has weighed several factors, including:
continued saber rattling from Iran
record production from the U.S.
draws from inventory featured in yesterday’s
E.I.A. report
global economic health – outside markets
Moving forward, the market should continue to weigh these factors in addition to further developments. Should the market trade past the averages pictured in the chart below, there is the possibility that the market trades toward the upper end of its range, especially considering a potential double bottom the June and August lows. Should the market remain below the averages, it is not difficult to imagine the market re-testing the some of the years lows.
Crude Oil Oct '19 Daily ChartEnergy - Natural Gas Trading Sideways...For Now
Natural Gas Trading Sideways...For Now
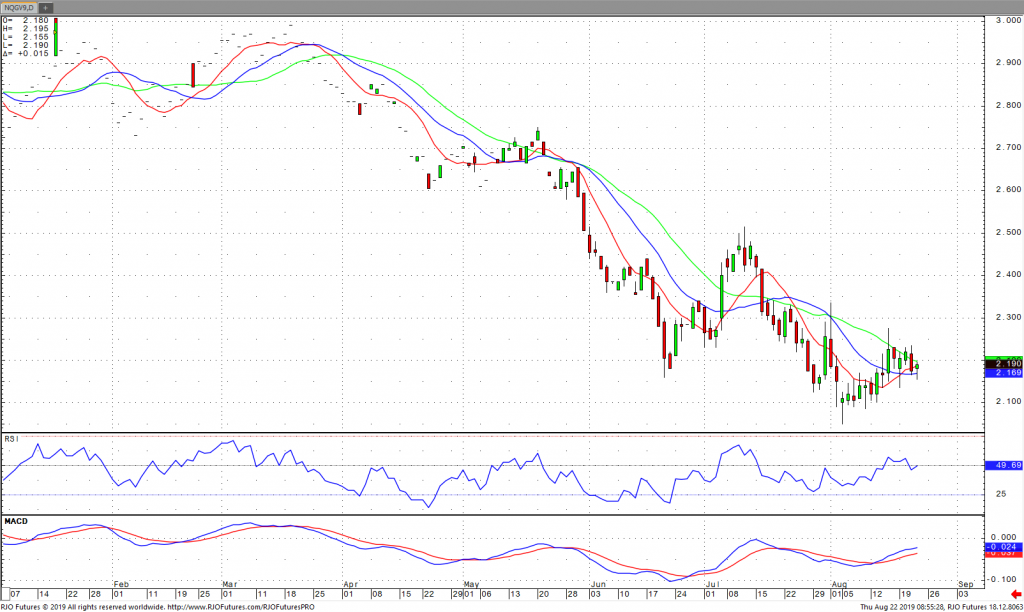
By: Jeff RatajczakPosted 08/22/2019
Natural gas for October is trading sideways right now. A slight uptrend had taken place until it flattened out today. If we can break yesterday’s high the uptrend will continue. Today’s pivot number is $2.173 with $2.160 and $2.140 as support numbers below. Overhead resistance looks like $2.190. Above that, $2.203 to $2.263 should be the next trading range higher. Momentum studies seem to be around mid-levels but trending higher. Prices should accelerate in the direction of these indicators. MACD and RSI look to be trending up.
Weather for the upcoming week looks good as cooler temperatures than previous weeks are expected. This may put damper on the bull market. We are getting to the end of the cooling season and the heating season is not yet in effect. Demand can be decreased by an economic slowdown as well. The EIA storage report estimates a build of 57 bcf. If today’s number surprises by being larger, $2.050 may be breached, but the path of least resistance remains up. On the other hand, a smaller number than the forecast will drive the market higher.
Nat Gas Oct '19 Daily ChartSofts - Rebound in Cocoa
Rebound in Cocoa
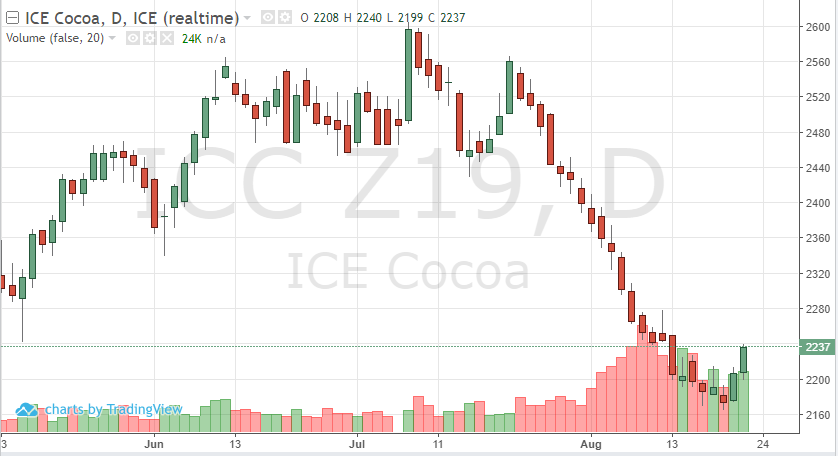
By: Peter MoosesPosted 08/23/2019
Cocoa’s main stories have been on repeat this year – supply/demand, global uncertainty, and grinding data, have created volatility in the futures. This recent sell-off, mainly from the lack of demand, Asian demand, due to the global trade tensions have finally caused cocoa to reach oversold levels. A recovery should be on the way. Global equities have comeback slightly, currencies have given softs a little push higher as well. Grinding data is coming in mixed. If resistance levels can be broken, 2280 – look for a move above 2300. The recent equity trade in the U.S. markets, as well as overseas could turn any market around as we saw over the past few weeks. Technically, look at moving averages for guidance in the short-term.
Cocoa Dec '19 Daily ChartSofts - Coffee Finding a Bottom?
Coffee Finding a Bottom?
By: Adam TuiaanaPosted 08/21/2019
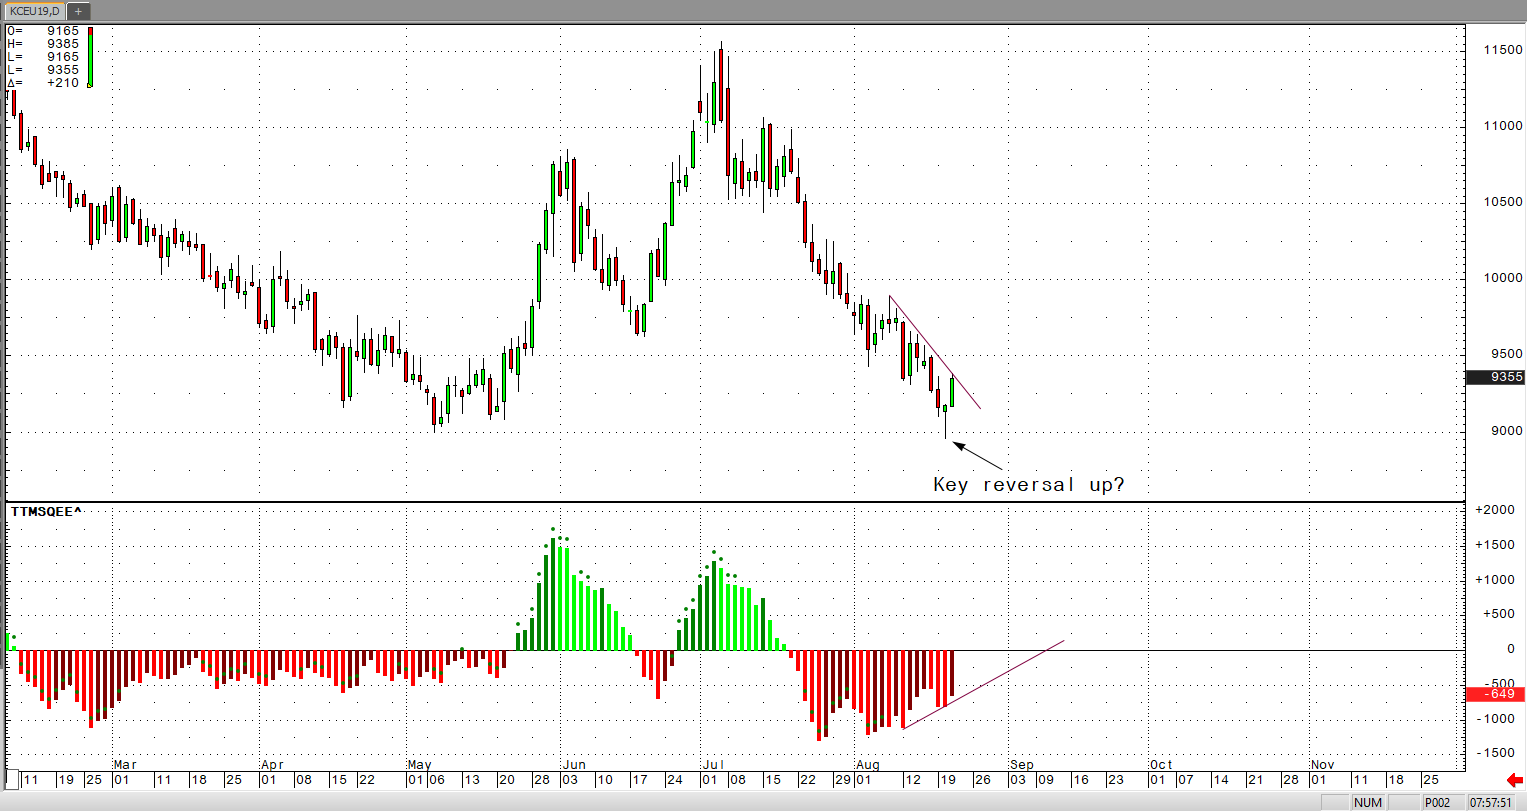
Coffee prices continue to resume a downtrend that
has been in place since July 5th. However, with the U.S. dollar now
facing strong resistance at the 9900 level, and a potential double-top reversal
down, the Brazilian currency is finding some good support and thus we may
likely see a bounce in coffee prices in the near term.
In my last article, I noted that our friends at The
Hightower Group had reported that “Vietnam’s
Central Highlands growing region is forecast to receive 20% to 40% less rain
than normal this month, with temperatures expected to be slightly above
average.” These weather concerns in Vietnam have not seen much reported
improvement and may also continue to help support higher coffee prices.
There may likely be a strong case for a key reversal up. Yesterday’s low of 8960 sparked strong buying support, which pushed September coffee to end on the day’s highs. Subsequently, we’ve seen a strong overnight rally, with momentum levels trending higher and diverging from the falling price action. This could signal a strong move higher in the near term.
On
the heels of mid-Sep-to-early-Oct's steeper, accelerated, 3rd-wave-looking
recovery, the past week-and-a-half's boringly lateral chop is first considered
a corrective/consolidative event that warns of a continuation of the uptrend
that preceded it to new highs above 04-Oct's 891.0 high. This count
remains consistent with our broader base/correction/recovery count introduced
in 13-Sep's Technical Blog following that
day's bullish divergence in short-term momentum above 07-Sep's 809.5 minor
corrective high detailed in the hourly chart below.
The
important takeaway from this month's lateral, sleepy price action is the
definition of Wed's 851.5 low as
the end or lower boundary of a suspected 4th-Wave correction. A failure
below 851.5 will confirm a bearish divergence in daily momentum and defer or
threaten a bullish count enough to warrant non-bullish decisions like
long-covers. A failure below 851.5 will not
necessarily negate a broader bullish count, but it will threaten it enough to
warrant defensive measures as the next pertinent technical levels below 851.5 are
13-Sep's prospective minor 1st-Wave high at 813.8 and obviously 08-Sep's 766.0
low. And making non-bullish decisions "down there" is
sub-optimal to say the least. Per such, both short- and longer-term
commercial traders are advised to pare or neutralize bullish exposure on a
failure below 851.5, acknowledging and accepting whipsaw risk- back above 04-Oct's
891.0 high- in exchange for much deeper and sub-optimal nominal risk below
766.0.
On
a broader scale, the daily log scale chart above shows the developing potential
for a bearish divergence in daily momentum that will be considered confirmed
below 851.5. This chart also shows the past month's recovery thus far
stalling in the immediate neighborhood of the (888.0) Fibonacci
minimum 38.2% retrace of Apr-Sep's entire 1128 - 766 decline). COMBINED
with a failure below 851.5, traders
would then need to be concerned with at least a larger-degree correction pf the
past month's rally and possibly a resumption of Apr-Sep's major downtrend.
Until
and unless the market fails below 851.5 however, we would
remind longer-term players of the key elements on which our bullish count is
predicated:
a confirmed bullish divergence in WEEKLY momentum
(below)
amidst
an
historically low 11% reading in out RJO Bullish Sentiment Index and
a
textbook complete and major 5-wave Elliott sequence down from 29-Apr's
1128 high to 08-Sep's 766.0 low.
Thus
far, the market is only a month into correcting a 4-MONTH, 32% drawdown, so
further and possibly protracted gains remain well within the bounds of a major
(suspected 2nd-Wave) correction of Apr-Sep's decline within an even more
massive PEAK/reversal process from 17-May's 1219 high on an active continuation
basis below.
These
issues considered, a bullish policy and exposure remain advised with a failure
below 851.5 required to defer or threaten this call enough to warrant moving to
a neutral/sideline position. In lieu of such weakness, we anticipate a
continuation of the past month's rally to new highs and potentially significant
gains above 891.0.
Agricultural - Grain Futures Update w/Stephen Davis - 8/23/2019
Grain Futures Update w/Stephen Davis - 8/23/2019
By: Stephen DavisPosted 08/23/2019
RJO Futures Senior Market Strategist Stephen Davis discusses the grain futures markets. If you have any questions or would like to discuss the markets further, please feel free to contact me at 800-367-7181 or sdavis@rjofutures.com.
Agricultural - Without Demand in Corn, Lower Yield and Harvest May Not Matter
Without Demand in Corn, Lower Yield and Harvest May Not Matter
By: Tony Cholly, Senior Market StrategistPosted Aug 23, 2019 8:47AM CT
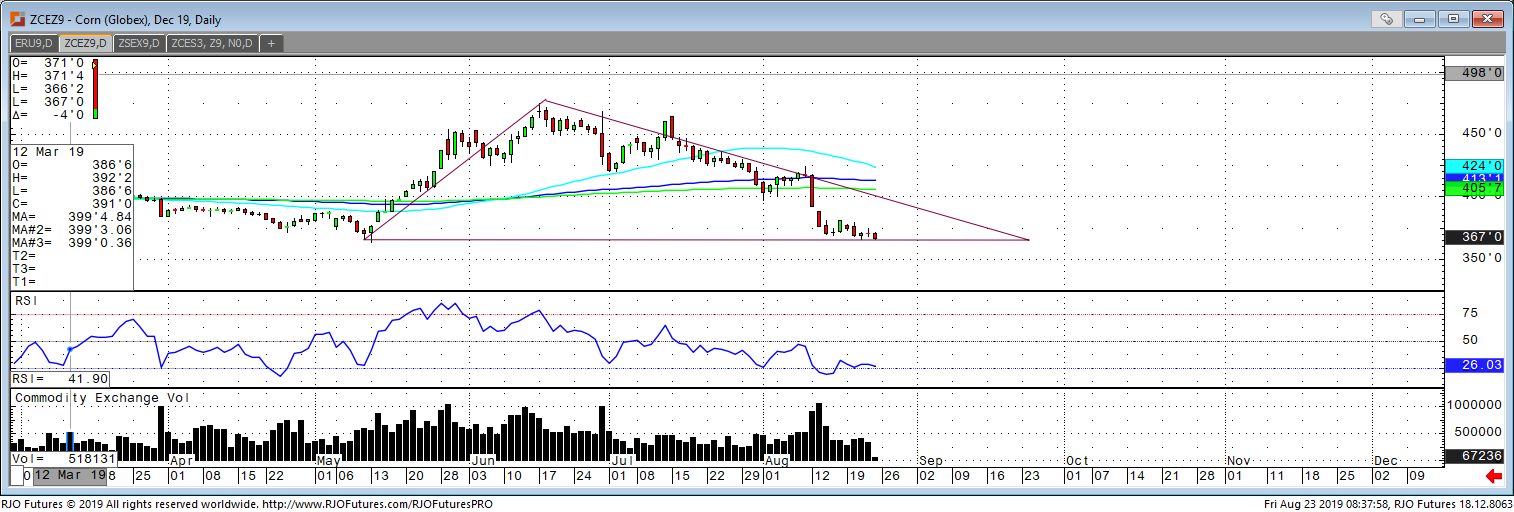
Increasing trade wars are a bearish force in the grains this morning, and this is helping spark more long liquidation. Disappointing yield results in the Pro Farmer crop tour helped to support yesterday, with every state coming in lower than the USDA projected on August 12th. Iowa came in at 182.8 compared to the USDA 191 estimate and Illinois came in at 171.2 compared to USDA estimate of 181. Iowa and Illinois are typically two states we can count on raising yield estimates, but if these numbers are accurate from the Pro Farmer crop tour, then I expect to see that 169 avg yield be revised in the next report. Weekly export sales for corn were below average coming in at 119,300 tonnes for the current marketing year and 301,600 for the next marketing year for a total of 420,900 tonnes. As of August 15th, cumulative corn sales stand at just 9% of the USDA forecast for 2019/2020 marketing year vs a 5-year average of 17% at this time. Support is seen at 366.75 and resistance at 374.25.
Corn Dec '19 Daily Chart If you have any questions or would like to discuss the markets further, please feel free to contact me at 800-826-2270 or tcholly@rjofutures.com. Interest Rates - Bonds Continue to Signal Deceleration in Growth
Bonds Continue to Signal Deceleration in Growth
By: Alexander Turro, Senior Market StrategistPosted Aug 23, 2019 7:33AM CT
U.S. government bond prices moved lower for the second consecutive session on Thursday, following a contractionary economic print as ISM manufacturing fell below the 50.0 threshold for the first time since September 2009. This comes amidst a seventh consecutive month of contraction for Germany and only further reaffirms the current manufacturing recession in the Eurozone’s largest economy. This recent data print is coupled with a preliminary report that the economy added over 500k less jobs between 2018 and 2019, which would be the largest revision since 2009. This confirmation of a deceleration of domestic and global growth was only reaffirmed by a brief inversion of the 2-year/10-year treasury spread, with outlook concentrated on Fed Chairman Powell’s speech at the Jackson Hole symposium on Friday. While Powell is expected to preface with an update on the continued risks to trade and growth, the focus will be on expectations of further adjustments by the Fed in September. As growth continues to decelerate look for yields to continue to trend sideways to lower with the current range on the benchmark ten-year yield seen between 1.47 – 1.74.
U.S. 10-Year Yield Sep '19 Daily Chart If you have any questions or would like to discuss the markets further, please feel free to contact me at 800-438-4805 or aturro@rjofutures.com. Equity - Stocks Showing Signs of Strength After Powell Speech
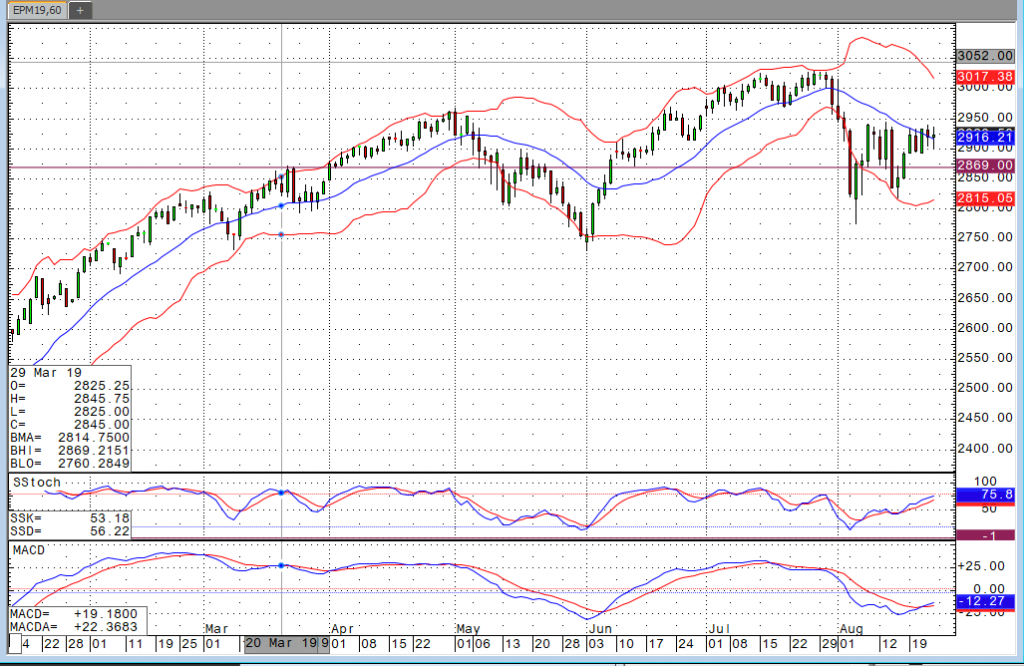
Stocks Showing Signs of Strength After Powell Speech
By: Bill Dixon, Senior Market StrategistPosted Aug 23, 2019 9:55AM CT
It took a bit, but stocks are
rallying following Fed Chairman Powell’s comments from Jackson Hole,
Wyoming. Prior to his remarks, stocks
were down quite a bit. The overnight
weakness can be largely attributed to news that China announced a new round of
tariffs on U.S. products. The tariffs
will be placed on our agricultural products, beef, and pork. Considering that
they haven’t been buying our products of late anyway, I’m not terribly sure
this changes a whole lot.
Powell once again said, “We will act as appropriate to sustain the expansion.” He also menitoned that the economy is in a good place, but that significant risks still exist. He feels inflation is moving closer to the goal of 2 percent, and he’s concerned about a global slowdown. Ultimately, it appears we’re still on track for another cut next month, he provided no other details directly related to rates. The rest of the day’s news slate is pretty slim, but next week’s should provide some excitement. The highlight of which being Thursday’s GDP reading.
E-Mini S&P 500 60 Min Chart If you have any questions or would like to discuss the markets further, please feel free to contact me at 800-669-5354 or bdixon@rjofutures.com. Economy - S-T Mo Failure Insufficient to End RBOB Correction, But Beware
S-T Mo Failure Insufficient to End RBOB Correction, But Beware
By: RJO Market InsightsPosted 11/08/2022
Posted on Nov 08, 2022, 07:51 by Dave Toth
In Fri's Technical Webcast we identified a
minor corrective low at 2.6328 from Thur as a mini risk parameter the market
needed to sustain gains above to maintain a more immediate bullish count.
The 240-min chart below shows the market's failure overnight below this level,
confirming a bearish divergence in very short-term momentum. This mo
failure defines Fri's 2.8172 high as
one of developing importance and a parameter from which very short-term traders
can objectively base non-bullish decisions like long-covers.
Given
the magnitude of the past three weeks' broader recovery however, this
short-term momentum failure is of an insufficient scale to conclude anything
more than another correction within this broader recovery from 26-Sep's 2.1877
low. Indeed, overnights failure below 2.6328 only allows us to conclude
the end of the portion of the month-and-a-half rally from 31-Oct's 2.4822 next
larger-degree corrective low. 2.4822 is the
risk parameter this market still needs to fail below to break the uptrend from
18-Oct's 2.3526 low while this 2.3526 low
remains intact as the risk parameter this market needs to fail below to break
the month-and-a-half uptrend. From an
intermediate-to-longer-term perspective, this week's setback falls well within
the bounds of another correction ahead of further gains. This is another
excellent example of the importance of technical and trading SCALE and
understanding and matching directional risk exposure to one's personal risk
profile.
The
reason overnight's admittedly minor mo failure might have longer-term
importance is the 2.8172-area from which it stemmed. In
Fri's Technical Blog we also noted the market's engagement of the
2.8076-to-2.8159-area marked by the 61.8% retrace of Jun0-Sewp's 3.2758 -2.1877
decline and the 1.000 progression of Sep-Oct's initial 2.1877 - 2.6185
(suspected a-Wave) rally from 18-Oct's 2.3526 (suspected b-Wave) low. We
remind longer-term players that because of the unique and compelling confluence
of:
early-Aug's bearish divergence in WEEKLY momentum
amidst
historically
extreme bullish sentiment/contrary opinion levels in our RJO Bullish
Sentiment Index
an
arguably complete and massive 5-wave Elliott sequence from Mar'20's 0.4605
low to Jun's 4.3260 high (as labeled in the weekly log active-continuation
chart below) and
the
5-wave impulsive sub-division of Jun-Sep's (suspected initial 1st-Wave) decline
The
recovery attempt from 26-Sep's 2.1877 low is arguably only a 3-wave (Wave-2)
corrective rebuttal to Jun-Sep's decline within a massive, multi-quarter
PEAK/reversal process. Now granted, due to the magnitude of 2020 -2022's
secular bull market, we discussed the prospect for this (2nd-Wave corrective)
recovery to be "extensive" in terms of both price and time. A
"more extensive" correction is typified by a retracement of 61.8% or
more and spanning weeks or even months following a 3-month decline. Per
such, the (suspected corrective) recovery from 26-Sep's 2.1877 low could easily
have further to go, with commensurately larger-degree weakness than that
exhibited this week (i.e., a failure below at least 2.4822) required
to consider the correction complete. Indeed, the daily log chart above
shows the market thus far respecting former 2.6185-area resistance from 10-Oct
as a new support candidate.
These
issues considered, very shorter-term traders have been advised to move to a neutral/sideline
position following overnight's momentum failure below 2.6328, with a recovery
above 2.8172 required to negate this call, reaffirm the recovery and re-expose
potentially significant gains thereafter. For intermediate- and
longer-term players, a bullish policy and exposure remain advised with a
failure below 2.4822 required to threaten this call enough to warrant
neutralizing exposure. We will be watchful for another bearish divergence
in momentum following a recovery attempt that falls short of Fri's 2.8172 high
that would be considered the next reinforcing factor to a count calling that
2.8172 high the prospective end to the month-and-a-half 2nd-Wave
correction. In lieu of such, a resumption of the current rally to
eventual new highs above 2.8172 should not surprise.