Orion Multi-Trader is a high-performance, multi-asset, broker-neutral platform for sophisticated investors. A powerful analysis and trading tools that enables you to design, execute and manage automated order strategies with ease.
Easy order management directly from Charts, Price Ladder or Quotes
Technical indicators with Orion MT’s advanced charts
Design, execute and manage automated order strategies with ease
Simulated trading environment
The Markets
Metals - Gold Futures Need a New Catalyst
Gold Futures Need a New Catalyst
By: Joshua GravesPosted 08/30/2019
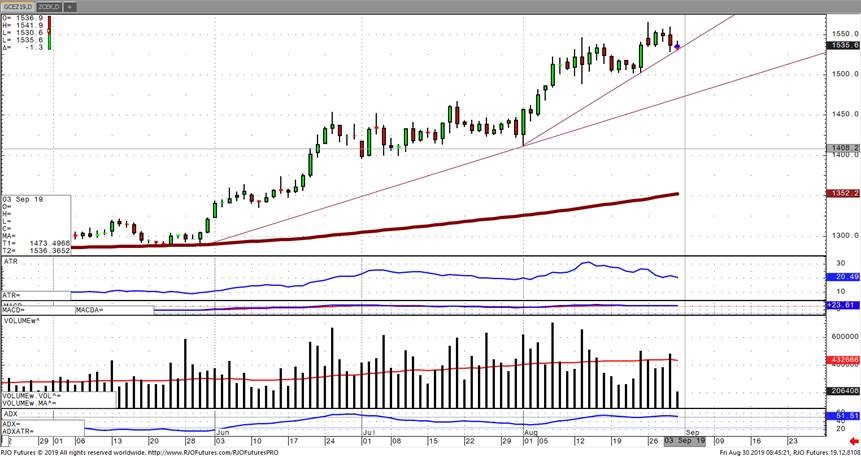
December gold futures have held up quite nicely given the recent surges in the stock market and the easing of trade tensions with China. Although the rhetoric could easily heat up once more between Trump and Xi, for now, it appears Trump wants to stop the stock market whip saw and get us marching back to the highs. There are a number of factors that are weighing on gold prices right now, and this is everything from the 4-week high’s seen in the U.S. dollar index to the still positive U.S. economic data that has been coming out for months. The trade tensions on pause and an already heavily long speculative managed money position is leaving us running out of steam now that we’ve had a $120 rally over the course of August. The record managed money long position has likely been broken, but we won’t know for sure until today’s COT report comes out. 288,000 contracts long is quite heavy indeed, and for another 100,000 contracts to be added we need more whipsaw in the stock market and more tension between the U.S. and China.
The December contract is testing the upward trend we’ve been in since August 1st. A break of this trend could threaten the August rally, and considering I’m not the only one watching the gold technicals there are a lot of traders long gold according to the COT report. When everyone is on one side of the trade a rush to the exit could trigger a washout below 1500. New catalysts to be bullish the precious metal need to be seen, and quickly. If you would like more information on how to play gold at these levels please contact me directly.
Gold Dec '19 Daily ChartMetals - Silver Futures on The Move
Silver Futures on The Move
By: Eli Tesfaye, Senior Market StrategistPosted Aug 30, 2019 7:36AM CT
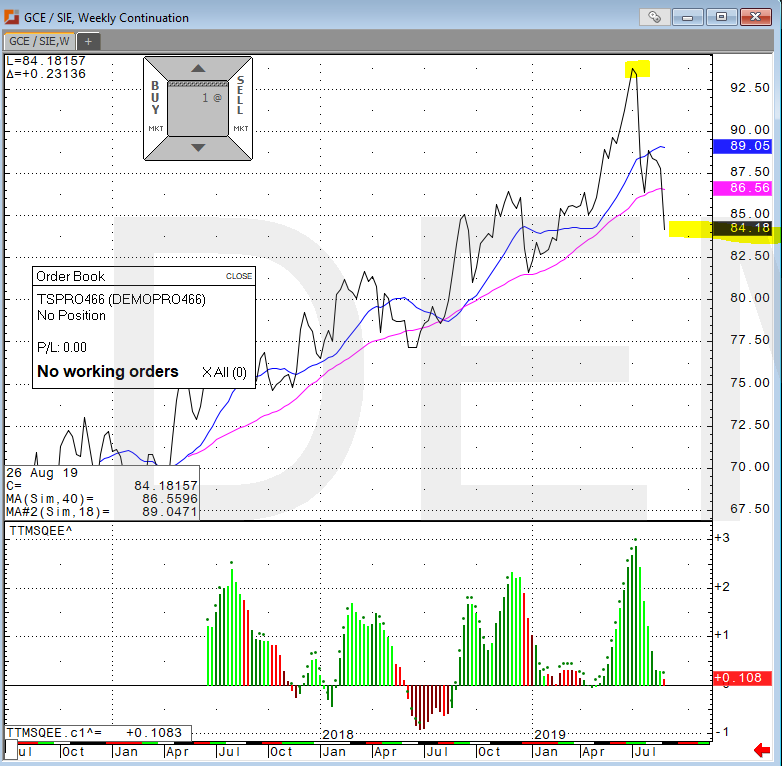
The chart below shows Gold/Silver ratio is favoring silver after hitting milt decade high. So, the moral of the story is that silver has more upside relative to gold. I would expect the spread to trade down to 60.00 area in the coming months. What I find even more interesting is that the U.S. dollar is very strong and so is silver. The U.S. Fed is struggling with pressure from President Trump and whispers of recession around the globe causing uncertainty in other investments. Silver having performed so well in this multi-month rally even with such a strong U.S. dollar could be considered very bullish indeed. There is strong chance the upcoming U.S. election season will inject further anxiety into equities causing indices to dip down even further which would support precious metals even further and could see silver go to $24.00 and beyond! Positive headlines could cause a pause in this rally but pull backs could become buying rather than selling opportunity.
Gold Silver Ratio Weekly Chart If you have any questions or would like to discuss the markets further, please feel free to contact me at 800-367-7290 or etesfaye@rjofutures.com. Energy - Crude Oil Trapped In a Range
Crude Oil Trapped In a Range
By: Phillip StreiblePosted 08/30/2019
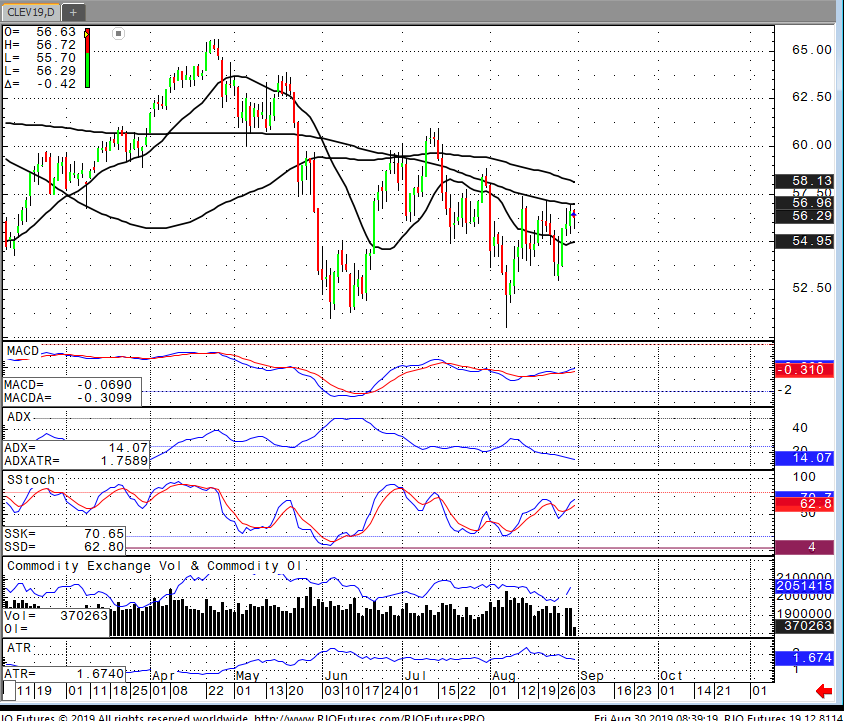
Oil futures continue to trade sideways despite a hefty drawdown on Wednesday of 10 million barrels. I would expect prices to stick between $58 and $52 until some major shift occurs in the markets. This could either be a resolution to the trade war between U.S. and China, a sudden decrease in interest rates, or an escalation in tensions between the U.S. and Iran. Digging into the EIA data we are seeing current inventories at 427 million barrels versus the five-year average of 422 million barrels. Looking at the technicals, stochastics are steadily rising but the ADX is weakening. This tells you that the strength of this upward momentum is extremely weak and the 200 DMA at $56.96 should act as solid resistance.
Crude Oil Oct '19 Daily ChartSofts - Sugar: The Trend is Your Friend
Sugar: The Trend is Your Friend
By: Joe NikrutoPosted 08/29/2019
This week’s comment finds the October sugar futures contract
carving out new lows for the move. In our last comment, we asked what fundamentals
could emerge that might drive prices lower. The record production from India
last year still must find a home as mentioned in this morning’s Hightower
report. They suggested that India will subsidize exports and this is weighing
on the market. Also mentioned was Mexico and new trade agreements with the U.S.
The result of the new agreement being Mexico will have upwards of 500,000 tonnes
of sugar that will also have to find a home as they will not be shipping it
into the U.S.
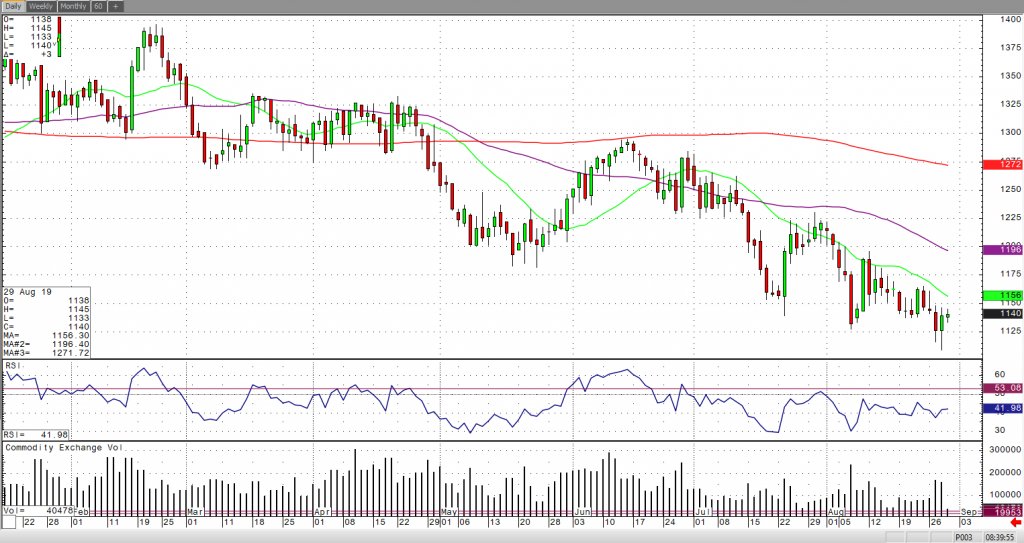
While the wire services have done a great job of bringing us new bearish fundamentals this week, today’s price action was more like sell the rumor buy the fact. After making new lows early in the session, sugar managed to close near yesterday’s high. This could be an early sign that bearish developments are now baked into our sugar cake. Overall, the trend is down. It has been my assertion, that as we moved further into the year and projections for deficits in production were met with ample supplies of sugar, up front price would continue to erode. The October contract remains just below the 18-day moving average, 11.54. Closes over the 18-day will likely signal the market is done going down for now and may need to consolidate in a range between 11.20 and 11.80. It is still summer. The Fund trader is short over 150,000 contracts. This is not a record, and there is room for more selling by the Funds. But, traders who are short should watch price action carefully to see if October stops reacting to bearish news. This is the time of year where a short short-covering rally could travel a lot of distance with very little fundamental fuel.
Sugar Oct '19 Daily ChartSofts - Are Coffee Futures Heating Up?
Are Coffee Futures Heating Up?
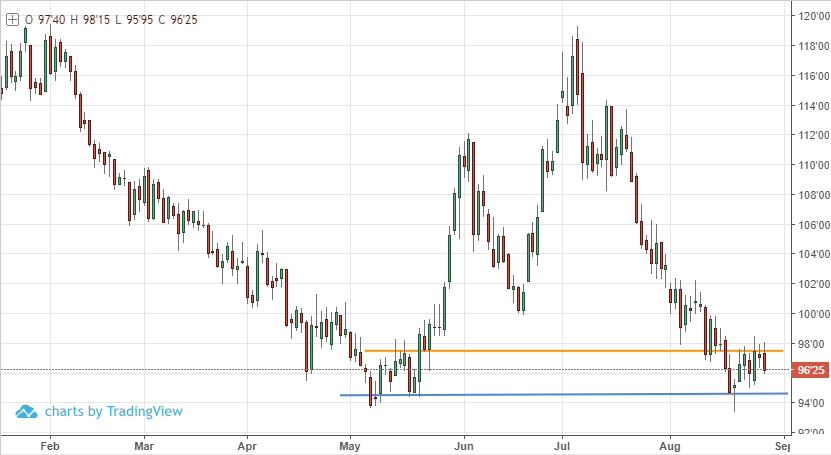
By: Eric ScolesPosted 08/28/2019
Dec ’19 coffee futures have been consolidating in a nearly identical range and holding the same support level as it had in May before spiking upwards. There appears to be strong support and possibly a firm bottom at 94’70 and a near term resistance at 97’50 as prices on the daily chart have failed to close above that level since dropping below it on Aug 16th. The fundamentals have been supportive with an anticipated production deficit with increased demand for this season. However, ample supplies from last season’s massive production surplus and weakness in producer currencies such as the Brazilian real have prevented prices from taking off thus far. As this seasons harvest wraps up the story will start to change from past to present and I believe with prices this cheap and what appears to be a bottom in place, purchasers of the physical goods will be inspired to buy, calendar spreads could be a strong indicator of this, if they start becoming less negative I’d consider it a bullish signal. Any positive news will could be enough to spark a rally in this market. With the cold months approaching, the coffee market could become warm and inviting for bulls.
On
the heels of mid-Sep-to-early-Oct's steeper, accelerated, 3rd-wave-looking
recovery, the past week-and-a-half's boringly lateral chop is first considered
a corrective/consolidative event that warns of a continuation of the uptrend
that preceded it to new highs above 04-Oct's 891.0 high. This count
remains consistent with our broader base/correction/recovery count introduced
in 13-Sep's Technical Blog following that
day's bullish divergence in short-term momentum above 07-Sep's 809.5 minor
corrective high detailed in the hourly chart below.
The
important takeaway from this month's lateral, sleepy price action is the
definition of Wed's 851.5 low as
the end or lower boundary of a suspected 4th-Wave correction. A failure
below 851.5 will confirm a bearish divergence in daily momentum and defer or
threaten a bullish count enough to warrant non-bullish decisions like
long-covers. A failure below 851.5 will not
necessarily negate a broader bullish count, but it will threaten it enough to
warrant defensive measures as the next pertinent technical levels below 851.5 are
13-Sep's prospective minor 1st-Wave high at 813.8 and obviously 08-Sep's 766.0
low. And making non-bullish decisions "down there" is
sub-optimal to say the least. Per such, both short- and longer-term
commercial traders are advised to pare or neutralize bullish exposure on a
failure below 851.5, acknowledging and accepting whipsaw risk- back above 04-Oct's
891.0 high- in exchange for much deeper and sub-optimal nominal risk below
766.0.
On
a broader scale, the daily log scale chart above shows the developing potential
for a bearish divergence in daily momentum that will be considered confirmed
below 851.5. This chart also shows the past month's recovery thus far
stalling in the immediate neighborhood of the (888.0) Fibonacci
minimum 38.2% retrace of Apr-Sep's entire 1128 - 766 decline). COMBINED
with a failure below 851.5, traders
would then need to be concerned with at least a larger-degree correction pf the
past month's rally and possibly a resumption of Apr-Sep's major downtrend.
Until
and unless the market fails below 851.5 however, we would
remind longer-term players of the key elements on which our bullish count is
predicated:
a confirmed bullish divergence in WEEKLY momentum
(below)
amidst
an
historically low 11% reading in out RJO Bullish Sentiment Index and
a
textbook complete and major 5-wave Elliott sequence down from 29-Apr's
1128 high to 08-Sep's 766.0 low.
Thus
far, the market is only a month into correcting a 4-MONTH, 32% drawdown, so
further and possibly protracted gains remain well within the bounds of a major
(suspected 2nd-Wave) correction of Apr-Sep's decline within an even more
massive PEAK/reversal process from 17-May's 1219 high on an active continuation
basis below.
These
issues considered, a bullish policy and exposure remain advised with a failure
below 851.5 required to defer or threaten this call enough to warrant moving to
a neutral/sideline position. In lieu of such weakness, we anticipate a
continuation of the past month's rally to new highs and potentially significant
gains above 891.0.
Agricultural - Grain Futures Update w/Stephen Davis - 08/30/2019
Grain Futures Update w/Stephen Davis - 08/30/2019
By: Stephen DavisPosted 08/30/2019
RJO Futures Senior Market Strategist Stephen Davis discusses the grain futures markets. If you have any questions or would like to discuss the markets further, please feel free to contact me at 800-367-7181 or sdavis@rjofutures.com.Agricultural - Have We Reached a Bottom in the Cattle Market?
Have We Reached a Bottom in the Cattle Market?
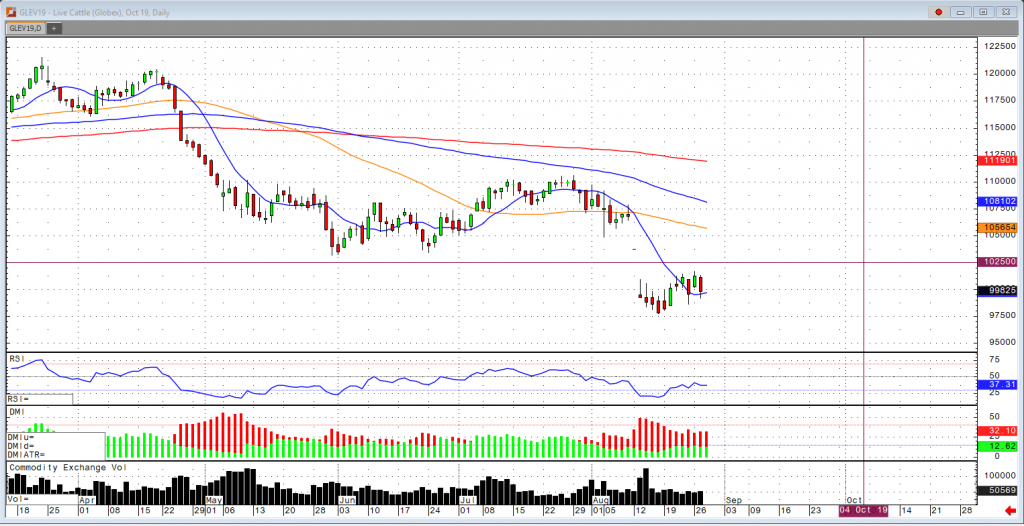
By: Peter McGinnPosted 08/28/2019
The theme remains the same in the cattle markets right now,
there is still a lot of near-term supply which leaves the market in bear
territory, but later into 2020 the market should look to turn to the upside.
The cash trade in Nebraska had 1,022 head traded at $108-$109 last Friday,
compared to $105-$107 the week prior. That begs the question, is the bottom in
on the cash market? If you take historical data dating back to 1990, there have
only been five years that declines have been recorded of 20% or greater, if you
take a 20% decline this year that brings the cash market to $102. Consumer
spending has remained robust as beef demand has been the better performer for
retailers. One must also realize that core retail spending is now growing at
its fastest pace since this data started to be recorded, which is mainly a
result of the rising employment and rising wages. Of course, one of the major
unknowns going forward is outside demand and the level of beef exports. Due to
China’s most recent import tariffs beef exports have been lagging all year. Keep
in mind, a 1% decline in domestic beef demand would require an increase of 9%
in beef exports to offset that 1% loss. In the October contract, dating back to
August 16th, you can see a slight uptrend with higher lows being
made and a close above the 10-day moving average yesterday. I still think the
near-term market trades up to the $102.500 level but no significant
breakthrough as the near-term supply and slaughter numbers are too great.
Last Friday, the cattle on feed report came out and showed
that it was in line with trade estimates, with 100.2% increase over last year.
Some standout statistics from this report I’ve noticed were that Iowa (-10%),
Minnesota (-15%), and Nebraska (-6%) all had declines of more than 5%. While
Colorado (+9%), and Kansas (+5%) had increases in their cattle on feed.
Placements fell short with only 97.9% being placed year over year and
marketing’s had a great performance showing a 6.9% increase year over year.
This shows that it will be necessary as a minor increase in market ready cattle
supplies will be realized in mid-September. Aggressive marketing posture needs
to be maintained to prevent any backlog from developing in October.
The USDA estimated cattle slaughter came in at 116,000 head yesterday. This was up from 115,000 last week but down from 120,000 a year ago. USDA boxed beef cutout values were up $1.58 at mid-session yesterday and closed 54 cents higher at $238.06. This was down from $239.13 the prior week.
Live Cattle Oct '19 Daily ChartCurrency - Global Uncertainty Continues to Support the U.S. Dollar
Global Uncertainty Continues to Support the U.S. Dollar
By: Ian BannonPosted 08/30/2019
September U.S. dollar futures poked above 98.50 Friday morning, but have since slid from off the highs. The market encountered some resistance at that level and needed a breath after this week’s bull run back to last week’s highs. The greenback remains the reserve currency of the world, and if our benchmark interest rate remains relatively high, investors around the globe will find safety in the USD. Adding to the bull camp is the fact that the United States economy is holding up while other developed economies are struggling. Germany reported a GDP contraction, and appears to be barreling toward recession. Meanwhile, U.S. GDP came in line with expectations at 2.0% growth in Q2… slowing, but not contractionary. If uncertainty heightens and geological tensions continue, investors will likely move away from stocks and into cash, with the U.S. offering the most attractive cash market.
The bear camp in the dollar is banking on more rate cuts into Q4. The odds of a 25 bps September rate cut are now above 98%, with increasing odds of more cuts at later meetings. Will this be enough to break the dollar? I don’t think so. These odds are priced into the market and the dollar continues higher. In the case of a surprise 50-75 bps cut (as Trump is insisting), the dollar could finally break off its highs. Safe-haven currencies, like the yen and the Swiss franc, are well off their highs, with the yen holding up better than the franc. Should the dollar eventually break, these currencies stand to benefit the most. Commodity currencies, like the Australian and Canadian dollar, are rangebound. Seasonal trends prefer these commodity currencies to the safe-haven currencies, while the euro and the pound remain subdued, with rallies continuing to fail. However, it appears the pound may be finding a bottom with the Brexit situation coming to an end in October.
USD September 19 Daily ChartEquity - Let’s Make a Deal!!!
Let’s Make a Deal!!!
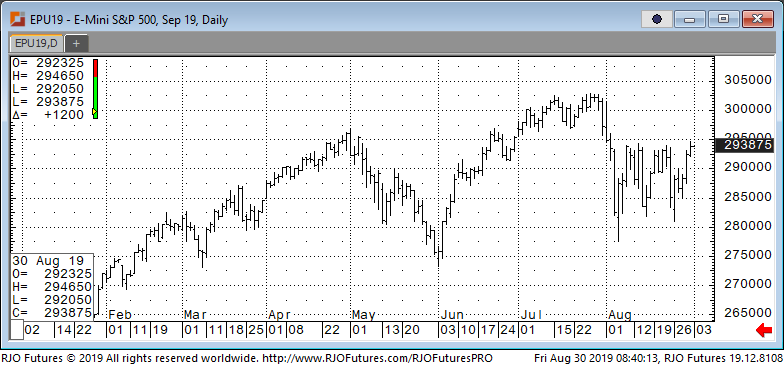
By: Jeff Yasak, Senior Market StrategistPosted Aug 30, 2019 9:14AM CT
U.S. stocks index futures are looking strong heading into today’s open as traders were optimistic that the United States and China will once again open the talks on a trade deal. The major indexes are looking to end the week with the biggest gains since June, this coming after selling pressure due to the intense trade tensions and worries of a looming recession. A continued increase on bond yields on Friday provided support for stocks. However, the 10-year treasury yield is still inverted, trading lower than the 2-year. This move has come before every recession over the past 50 years, though the decline has not been instantaneous. Earlier in the week, yields were under heavy pressure, with the 30-year Treasury yield on Wednesday hitting an all-time low.
Resistance is checking in today at 295500 and 297000 and support levels 289900 and 286000.
E-mini S&P 500 Sep '19 Daily Chart If you have any questions or would like to discuss the markets further, please feel free to contact me at 888-861-1656 or jyasak@rjofutures.com. Economy - S-T Mo Failure Insufficient to End RBOB Correction, But Beware
S-T Mo Failure Insufficient to End RBOB Correction, But Beware
By: RJO Market InsightsPosted 11/08/2022
Posted on Nov 08, 2022, 07:51 by Dave Toth
In Fri's Technical Webcast we identified a
minor corrective low at 2.6328 from Thur as a mini risk parameter the market
needed to sustain gains above to maintain a more immediate bullish count.
The 240-min chart below shows the market's failure overnight below this level,
confirming a bearish divergence in very short-term momentum. This mo
failure defines Fri's 2.8172 high as
one of developing importance and a parameter from which very short-term traders
can objectively base non-bullish decisions like long-covers.
Given
the magnitude of the past three weeks' broader recovery however, this
short-term momentum failure is of an insufficient scale to conclude anything
more than another correction within this broader recovery from 26-Sep's 2.1877
low. Indeed, overnights failure below 2.6328 only allows us to conclude
the end of the portion of the month-and-a-half rally from 31-Oct's 2.4822 next
larger-degree corrective low. 2.4822 is the
risk parameter this market still needs to fail below to break the uptrend from
18-Oct's 2.3526 low while this 2.3526 low
remains intact as the risk parameter this market needs to fail below to break
the month-and-a-half uptrend. From an
intermediate-to-longer-term perspective, this week's setback falls well within
the bounds of another correction ahead of further gains. This is another
excellent example of the importance of technical and trading SCALE and
understanding and matching directional risk exposure to one's personal risk
profile.
The
reason overnight's admittedly minor mo failure might have longer-term
importance is the 2.8172-area from which it stemmed. In
Fri's Technical Blog we also noted the market's engagement of the
2.8076-to-2.8159-area marked by the 61.8% retrace of Jun0-Sewp's 3.2758 -2.1877
decline and the 1.000 progression of Sep-Oct's initial 2.1877 - 2.6185
(suspected a-Wave) rally from 18-Oct's 2.3526 (suspected b-Wave) low. We
remind longer-term players that because of the unique and compelling confluence
of:
early-Aug's bearish divergence in WEEKLY momentum
amidst
historically
extreme bullish sentiment/contrary opinion levels in our RJO Bullish
Sentiment Index
an
arguably complete and massive 5-wave Elliott sequence from Mar'20's 0.4605
low to Jun's 4.3260 high (as labeled in the weekly log active-continuation
chart below) and
the
5-wave impulsive sub-division of Jun-Sep's (suspected initial 1st-Wave) decline
The
recovery attempt from 26-Sep's 2.1877 low is arguably only a 3-wave (Wave-2)
corrective rebuttal to Jun-Sep's decline within a massive, multi-quarter
PEAK/reversal process. Now granted, due to the magnitude of 2020 -2022's
secular bull market, we discussed the prospect for this (2nd-Wave corrective)
recovery to be "extensive" in terms of both price and time. A
"more extensive" correction is typified by a retracement of 61.8% or
more and spanning weeks or even months following a 3-month decline. Per
such, the (suspected corrective) recovery from 26-Sep's 2.1877 low could easily
have further to go, with commensurately larger-degree weakness than that
exhibited this week (i.e., a failure below at least 2.4822) required
to consider the correction complete. Indeed, the daily log chart above
shows the market thus far respecting former 2.6185-area resistance from 10-Oct
as a new support candidate.
These
issues considered, very shorter-term traders have been advised to move to a neutral/sideline
position following overnight's momentum failure below 2.6328, with a recovery
above 2.8172 required to negate this call, reaffirm the recovery and re-expose
potentially significant gains thereafter. For intermediate- and
longer-term players, a bullish policy and exposure remain advised with a
failure below 2.4822 required to threaten this call enough to warrant
neutralizing exposure. We will be watchful for another bearish divergence
in momentum following a recovery attempt that falls short of Fri's 2.8172 high
that would be considered the next reinforcing factor to a count calling that
2.8172 high the prospective end to the month-and-a-half 2nd-Wave
correction. In lieu of such, a resumption of the current rally to
eventual new highs above 2.8172 should not surprise.