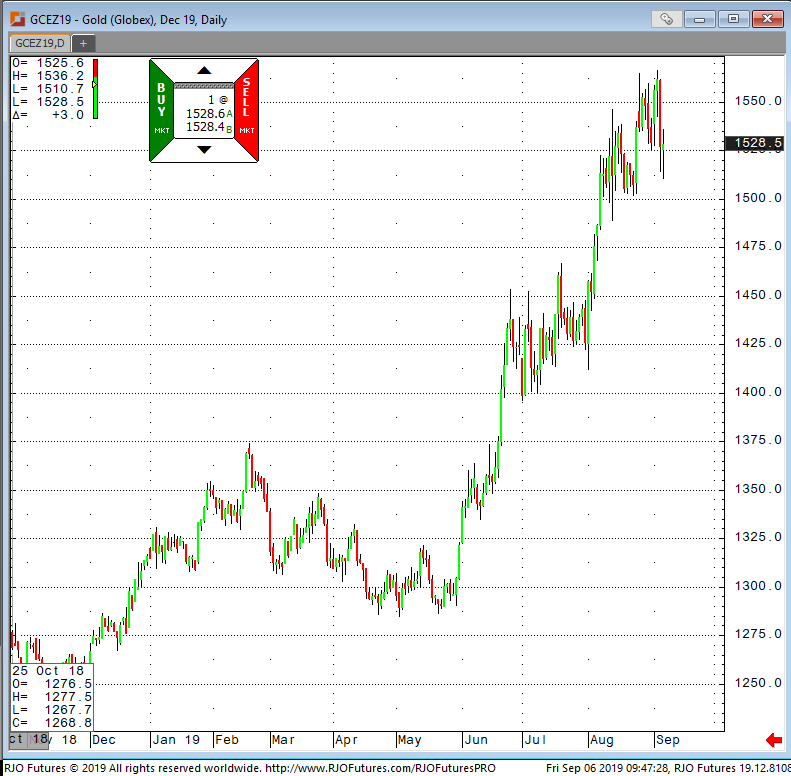
After a brief hiccup and slide overnight, gold is up once
again Friday morning as investors flock like seagulls to the precious metal.
RJO Futures Senior Market Strategist, Bob Haberkorn says “There is so much
flight to safety right now and metals is where a lot of that money is going…traders
that had been out of the metals market are coming back…and there’s been a lot
of buying from new accounts”.
The latest spike in gold is most likely due to the August jobs report which came out Friday morning. According to the report, hiring in August was lackluster adding a measly 130,000 jobs throughout the month. However, the unemployment rate remained the same at 3.7% which is still just above the 50-year low. Nonetheless, all the uncertainty in the jobs market and the possibility of another rate cut has driven investors to the safety of gold.
Support and resistance levels for December gold are as
follows:
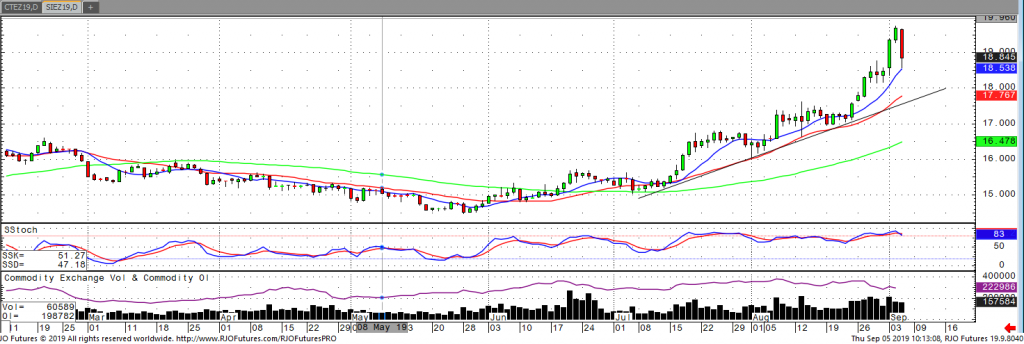
Multiple bullish themes were wiped off the table this week with the U.S. and China planning to continue trade talks with a meeting in October and Hong Kong withdrawing the extradition bill that sparked protests. Global equity markets have been stronger the second half of the week as well. The silver market was on track for its fifth week higher in a row and still might is Thursday’s selloff finds support. Initial jobless claims remained steady and US non-farm payrolls look to come in slightly below previous readings. While the silver market has had quite the run recently, outside market forces are favoring the bear cam to end the week. The bulls are holding onto hopes that U.S. and European economic data rekindles recession fears and with Thursday’s pullback, any extended gains in the equity markets will continue to pressure. With December silver breaking the reversal point on 19.28 support comes in at 18.30 and 18.15. Resistance comes in at Wednesday’s high of 19.75
If you have any questions or would like to discuss the markets further, please feel free to contact me at 800-826-2270 or therrmann@rjofutures.com. Energy - Crude Recovery Passing EIA Test
Crude Recovery Passing EIA Test
By: Michael O'DonnellPosted 09/05/2019
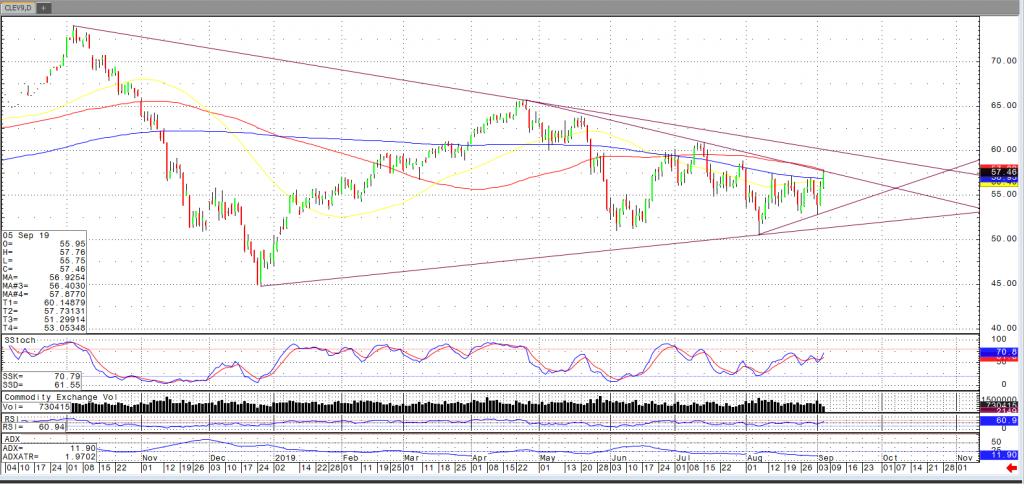
As of Thursday morning, the October 2019 Crude Oil contract
is trading up about $1.24 per barrel at $57.50 as the market weighs a number of
factors, including a 4.8-million barrel draw from the holiday delayed EIA this
morning. Also bullish for the market are some outside forces such as a weaker
dollar, announcements of trade talks between U.S. and China, and a good ADP
number this morning.
Of definite interest are the 200-day moving average and upper trendline pictured below. As many have noted the range of this market, I have also noted $57.50 frequently in these posts and the market seems to be respecting that level as of this writing. Further strength above these levels could bode well, whereas a failure could be a good opportunity to short back to the range.
Energy - Natural Gas Trending Up
Natural Gas Trending Up
By: Jeff RatajczakPosted 09/05/2019
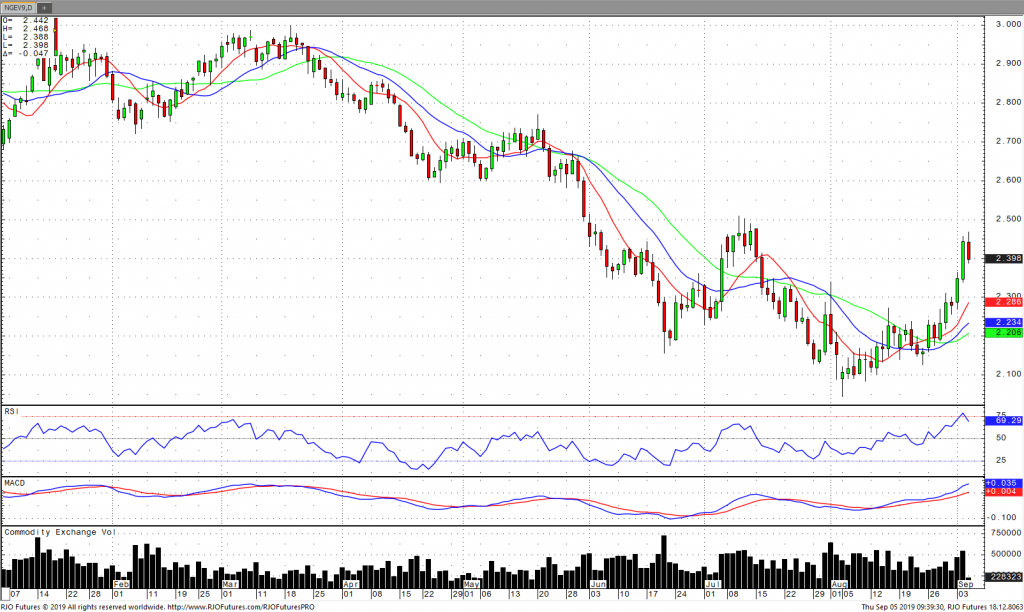
Natural gas for October has been in an uptrend since August
23 and all moving averages are pointing up.
Higher highs and higher lows are prevalent in the charting. Today’s
pivot is $2.411. Support comes in at $2.353 and $2.331 near yesterday’s low. Resistance
is penciled in at $2.468, today’s high. A close above $2.500 could take natural
gas to the next higher trading range, but beware the divergence in RSI, it
still has not broken too far from the overbought condition, but is beginning a
move downward. This may signal a down turn in prices should this continue.
The run up the last few sessions may be due to short covering. Stops have been violated and this may have lead the price to jump. The weather across 2/3 of the continental U.S. is forecast for above average temps, this should support the market a bit. The recent turn North of the hurricane has tempered the upside because most of the storm’s energy is out to sea. We are expecting a fairly large injection into storage with today’s numbers. 77-79 bcf is the amount estimated. Production remains high and the passing of hurricane Dorian to the North won’t affect the supply chain.
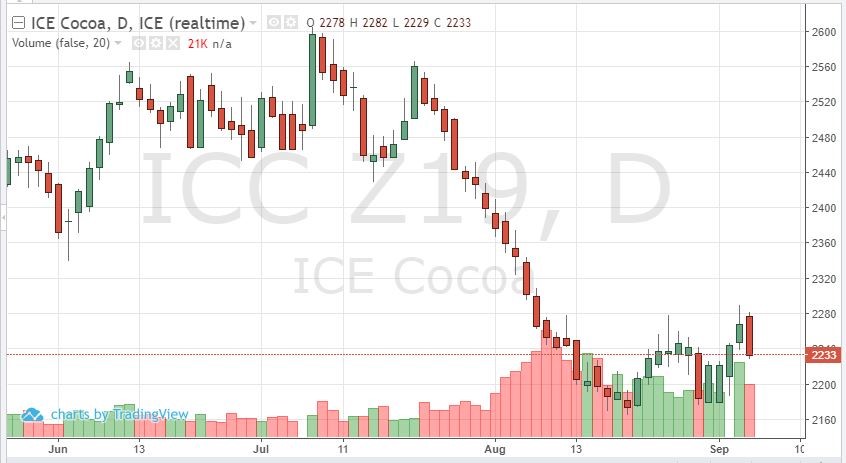
Cocoa Futures - Rally Stalled but Upside Potential Intact
By: Peter MoosesPosted 09/06/2019
After four strong trading sessions in the December cocoa futures, the contract took a pause and pulled back to the 2230 support level. Although most signs point to the potential of more upside, 2280 provided resistance technically. Demand seems strong after the European and Asian markets moved higher this week. With China trade talks seemingly back on, the U.S. equities also rallied. Brexit talks have added volatility to the currencies. The British Pound and Euro have strengthened, providing a push for cocoa prices. Production levels in the new calendar year will be monitored – will current weather conditions affect the longer-term output? West African weather fronts are supposed to produce substantial rain in the near term. Ghana and Nigeria are already dealing with disease in their crops, these patterns could add to the damage. As we approach the weekend, COT data could provide some insight on how traders are positioning themselves as we head into the final quarter of the year.
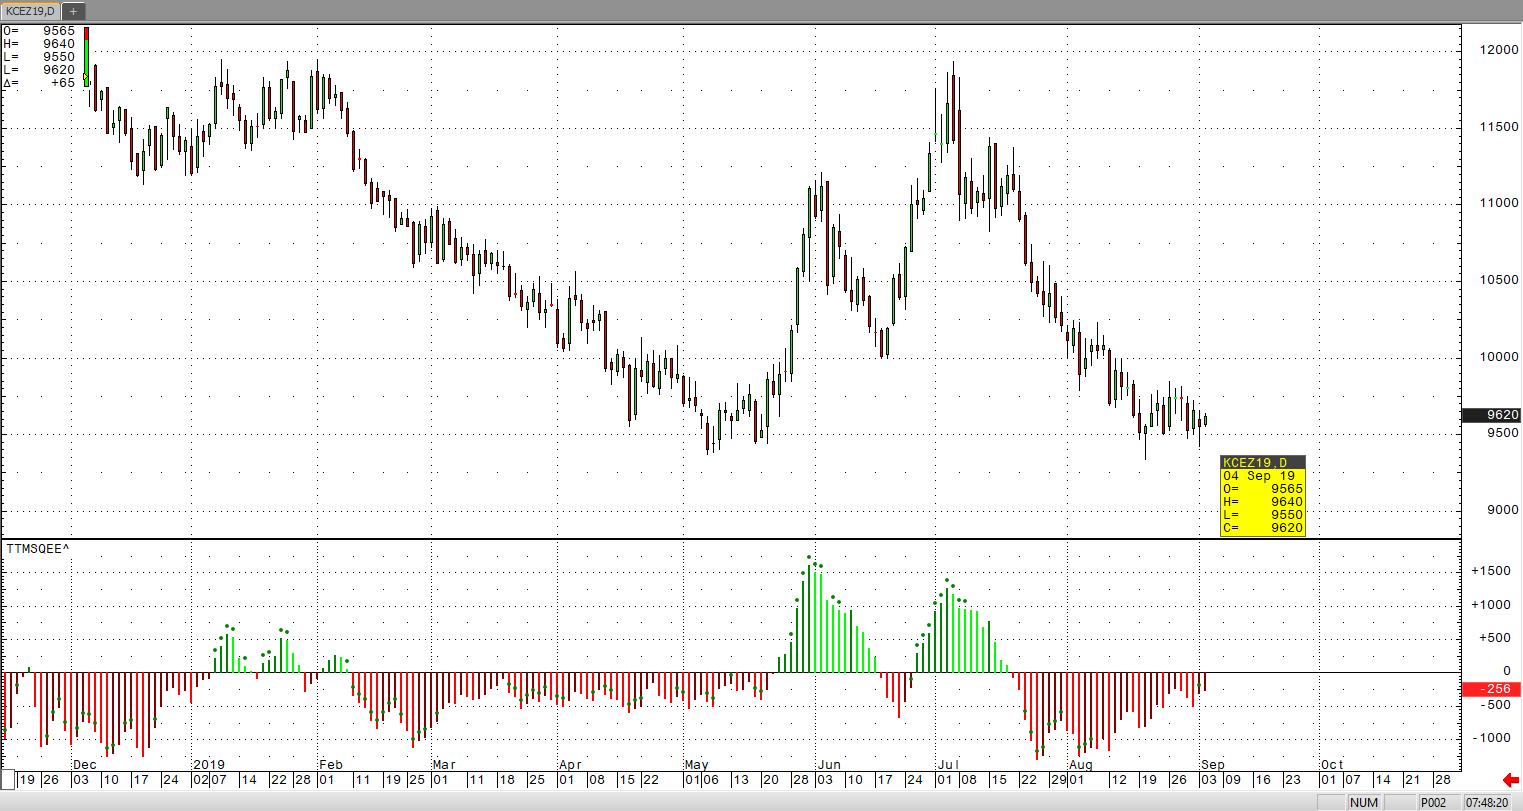
Softs - Coffee Sideways Consolidation
Coffee Sideways Consolidation
By: Adam TuiaanaPosted 09/04/2019
Although December coffee prices have met firm
resistance at the 9750 level, support levels are holding strong. In my last
article, I had outlined the key reversal up that may be taking place in
December coffee prices. The reversal up looks to be from the August 20th
price action, where the high was 9565 and the low was 9340. This technical
daily candle looks to have precipitated some good follow-through support. Key
producers in Columbia may have added some support to December coffee prices,
but offsetting any potential bull run is the currently bearish news from record
high supply numbers from Brazil last season. So much of that supply needs to be
met with strong demand, and with the U.S. stock market continuing to endure
massive volatile swings, lack of resolution with ongoing U.S.-China trade
talks, I would suspect it will be quite a bit of time until December coffee
makes a bull run back to the 100 level.
There should be solid support at the 9500 while the consolidation in price action takes place. Yesterday’s low of 9420 falls short of the 9340 reversal-up day. Upside resistance comes in around 9750, and a break above this well-defined range could signal a visit back to the 100 level.
On
the heels of mid-Sep-to-early-Oct's steeper, accelerated, 3rd-wave-looking
recovery, the past week-and-a-half's boringly lateral chop is first considered
a corrective/consolidative event that warns of a continuation of the uptrend
that preceded it to new highs above 04-Oct's 891.0 high. This count
remains consistent with our broader base/correction/recovery count introduced
in 13-Sep's Technical Blog following that
day's bullish divergence in short-term momentum above 07-Sep's 809.5 minor
corrective high detailed in the hourly chart below.
The
important takeaway from this month's lateral, sleepy price action is the
definition of Wed's 851.5 low as
the end or lower boundary of a suspected 4th-Wave correction. A failure
below 851.5 will confirm a bearish divergence in daily momentum and defer or
threaten a bullish count enough to warrant non-bullish decisions like
long-covers. A failure below 851.5 will not
necessarily negate a broader bullish count, but it will threaten it enough to
warrant defensive measures as the next pertinent technical levels below 851.5 are
13-Sep's prospective minor 1st-Wave high at 813.8 and obviously 08-Sep's 766.0
low. And making non-bullish decisions "down there" is
sub-optimal to say the least. Per such, both short- and longer-term
commercial traders are advised to pare or neutralize bullish exposure on a
failure below 851.5, acknowledging and accepting whipsaw risk- back above 04-Oct's
891.0 high- in exchange for much deeper and sub-optimal nominal risk below
766.0.
On
a broader scale, the daily log scale chart above shows the developing potential
for a bearish divergence in daily momentum that will be considered confirmed
below 851.5. This chart also shows the past month's recovery thus far
stalling in the immediate neighborhood of the (888.0) Fibonacci
minimum 38.2% retrace of Apr-Sep's entire 1128 - 766 decline). COMBINED
with a failure below 851.5, traders
would then need to be concerned with at least a larger-degree correction pf the
past month's rally and possibly a resumption of Apr-Sep's major downtrend.
Until
and unless the market fails below 851.5 however, we would
remind longer-term players of the key elements on which our bullish count is
predicated:
a confirmed bullish divergence in WEEKLY momentum
(below)
amidst
an
historically low 11% reading in out RJO Bullish Sentiment Index and
a
textbook complete and major 5-wave Elliott sequence down from 29-Apr's
1128 high to 08-Sep's 766.0 low.
Thus
far, the market is only a month into correcting a 4-MONTH, 32% drawdown, so
further and possibly protracted gains remain well within the bounds of a major
(suspected 2nd-Wave) correction of Apr-Sep's decline within an even more
massive PEAK/reversal process from 17-May's 1219 high on an active continuation
basis below.
These
issues considered, a bullish policy and exposure remain advised with a failure
below 851.5 required to defer or threaten this call enough to warrant moving to
a neutral/sideline position. In lieu of such weakness, we anticipate a
continuation of the past month's rally to new highs and potentially significant
gains above 891.0.
Agricultural - Grain Futures Update w/Stephen Davis - 09/06/2019
Grain Futures Update w/Stephen Davis - 09/06/2019
By: Stephen DavisPosted 09/06/2019
RJO Futures Senior Market Strategist Stephen Davis discusses the grain futures markets. If you have any questions or would like to discuss the markets further, please feel free to contact me at 800-367-7181 or sdavis@rjofutures.com.Agricultural - Same Old Song and Dance in Corn
December corn briefly traded up to 362 early yesterday, before a negative ethanol production number reminded traders there is no demand right now. Ethanol production for the week ending Aug 30th, was down 2.4% vs. last week and down 6.8% vs last year. Corn use has already met this year’s USDA estimate of 5.425 billion bushels. Stocks were 23.801 million bushels. This is up 3.5% vs last week and 4.8% vs last year. The global grains production for the 2019-2020 season is seen at 2.7 million tonnes, up .9% from prior forecast and 2.1% higher than last year according to UN’s food and ag organization. Some firms see the 2019-2020 Brazilian summer corn crop at 26.3 million tonnes, roughly the same as last year. Planted area is also seen as basically unchanged at 4.9 million hactares. Corn support comes in at 352 and resistance at 365. A close over 376 is needed to wake up the bulls.
If you have any questions or would like to discuss the markets further, please feel free to contact me at 800-826-2270 or tcholly@rjofutures.com. Currency - Resumption of Trade Talks Causes Safe-Haven Liquidation
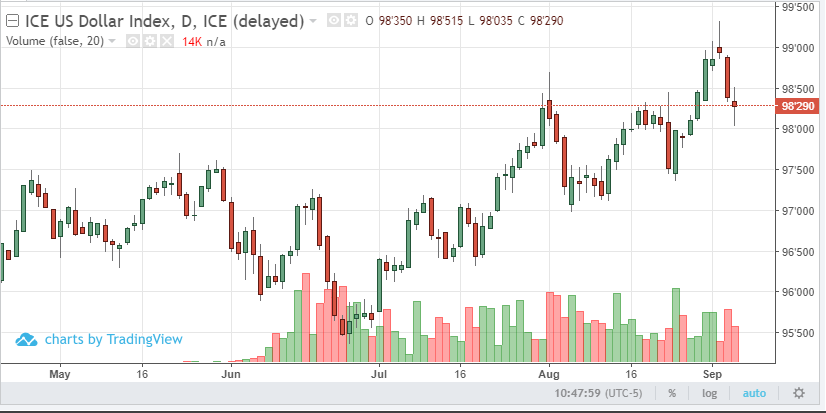
Resumption of Trade Talks Causes Safe-Haven Liquidation
By: Ian BannonPosted 09/05/2019
U.S. dollar futures moved lower on Thursday morning
for a third day in a row, down about 100 points off the weekly high. Tuesday’s
“evening star” pattern is a reversal signal that indicates the top in the
dollar may be in place. Remember, the USD is currently the reserve currency of
the world, so when market tensions are high, money typically flows in to the
dollar. With news of a resumption of U.S./China trade talks, we are seeing
money flow out of the cash market and back into equities. Safe-haven
currencies, like the yen and the Swiss franc, are selling off today as renewed
optimism takes hold of economic sentiment. The British pound, and to a lesser
degree, the euro, have caught a bid this week and moved to the upside from
oversold levels.
Fundamentally speaking, pound bulls are optimistic about a “just get it done” attitude regarding the Brexit situation. The falling dollar and risk-off sentiment is aiding commodity currencies as well. It appears a bottom may be set in the pound. However, there is political uncertainty, and therefore trade risk, with the possibility of Boris Johnson being ousted as prime minister in the case of mid-October elections. But, the big topic in the global economy is clearly the trade war. President Xi is in no hurry to make a deal. He is hoping Trump will not win next year’s vote, allowing Xi to most likely close a better trade deal with a more docile US president. Furthermore, Xi has been rolling out punches of his own, as his patience with Trump’s stubbornness is dwindling. In short, I would not hold my breath on a deal coming out of this supposed meeting next month. In the case of another negotiation failure, safe-haven markets are likely to rally once more after selling off and finding support at current levels.
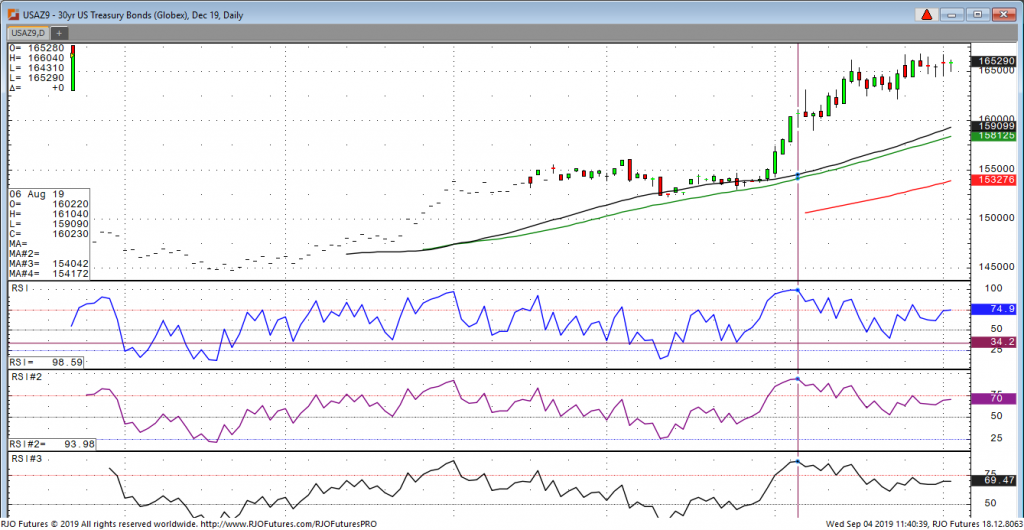
The bonds have been on a tear for the for the last few months with the December contract hitting contract highs yesterday at 166.23 on continued unrest in Hong Kong, ongoing tariffs and a weak PMI reading yesterday that came in at 49 and change. Any number that comes in below 50 is considered a contraction in the economy. Overnight, we saw some decent economic news out of Europe which has pushed yields up and spilled over to the U.S. bond market. In general, the world economy is no doubt slowing, with many countries near or at recession levels, and at the same time, the U.S. is acting far better, in fact, some would argue that data has been on the strong side as of late. A key number to watch this week is the monthly employment number. Most have predicting in the last few months that the non-farm payrolls would be slowing down, but we have actually seen very good numbers. So, Friday’s number will be watched closely as many doves are hoping for a bad number, so the fed will continue to cut rates. One reason the bonds have been so strong the last few months is that the European yield curve is negative. If one were to put money in a European bank for let’s say three months, they would lose money as you are basically paying the bank to hold your money because rates are negative. So, many investors overseas are putting their money in U.S. treasuries, despite the low rate in the 10-year note, which is around 1.46%. The yield is very low but at least it’s not negative.
30-Yr T-Bond Dec '19 Daily Chart If you have any questions or would like to discuss the markets further, please feel free to contact me at 800-826-2270 or gperlin@rjofutures.com. Economy - S-T Mo Failure Insufficient to End RBOB Correction, But Beware
S-T Mo Failure Insufficient to End RBOB Correction, But Beware
By: RJO Market InsightsPosted 11/08/2022
Posted on Nov 08, 2022, 07:51 by Dave Toth
In Fri's Technical Webcast we identified a
minor corrective low at 2.6328 from Thur as a mini risk parameter the market
needed to sustain gains above to maintain a more immediate bullish count.
The 240-min chart below shows the market's failure overnight below this level,
confirming a bearish divergence in very short-term momentum. This mo
failure defines Fri's 2.8172 high as
one of developing importance and a parameter from which very short-term traders
can objectively base non-bullish decisions like long-covers.
Given
the magnitude of the past three weeks' broader recovery however, this
short-term momentum failure is of an insufficient scale to conclude anything
more than another correction within this broader recovery from 26-Sep's 2.1877
low. Indeed, overnights failure below 2.6328 only allows us to conclude
the end of the portion of the month-and-a-half rally from 31-Oct's 2.4822 next
larger-degree corrective low. 2.4822 is the
risk parameter this market still needs to fail below to break the uptrend from
18-Oct's 2.3526 low while this 2.3526 low
remains intact as the risk parameter this market needs to fail below to break
the month-and-a-half uptrend. From an
intermediate-to-longer-term perspective, this week's setback falls well within
the bounds of another correction ahead of further gains. This is another
excellent example of the importance of technical and trading SCALE and
understanding and matching directional risk exposure to one's personal risk
profile.
The
reason overnight's admittedly minor mo failure might have longer-term
importance is the 2.8172-area from which it stemmed. In
Fri's Technical Blog we also noted the market's engagement of the
2.8076-to-2.8159-area marked by the 61.8% retrace of Jun0-Sewp's 3.2758 -2.1877
decline and the 1.000 progression of Sep-Oct's initial 2.1877 - 2.6185
(suspected a-Wave) rally from 18-Oct's 2.3526 (suspected b-Wave) low. We
remind longer-term players that because of the unique and compelling confluence
of:
early-Aug's bearish divergence in WEEKLY momentum
amidst
historically
extreme bullish sentiment/contrary opinion levels in our RJO Bullish
Sentiment Index
an
arguably complete and massive 5-wave Elliott sequence from Mar'20's 0.4605
low to Jun's 4.3260 high (as labeled in the weekly log active-continuation
chart below) and
the
5-wave impulsive sub-division of Jun-Sep's (suspected initial 1st-Wave) decline
The
recovery attempt from 26-Sep's 2.1877 low is arguably only a 3-wave (Wave-2)
corrective rebuttal to Jun-Sep's decline within a massive, multi-quarter
PEAK/reversal process. Now granted, due to the magnitude of 2020 -2022's
secular bull market, we discussed the prospect for this (2nd-Wave corrective)
recovery to be "extensive" in terms of both price and time. A
"more extensive" correction is typified by a retracement of 61.8% or
more and spanning weeks or even months following a 3-month decline. Per
such, the (suspected corrective) recovery from 26-Sep's 2.1877 low could easily
have further to go, with commensurately larger-degree weakness than that
exhibited this week (i.e., a failure below at least 2.4822) required
to consider the correction complete. Indeed, the daily log chart above
shows the market thus far respecting former 2.6185-area resistance from 10-Oct
as a new support candidate.
These
issues considered, very shorter-term traders have been advised to move to a neutral/sideline
position following overnight's momentum failure below 2.6328, with a recovery
above 2.8172 required to negate this call, reaffirm the recovery and re-expose
potentially significant gains thereafter. For intermediate- and
longer-term players, a bullish policy and exposure remain advised with a
failure below 2.4822 required to threaten this call enough to warrant
neutralizing exposure. We will be watchful for another bearish divergence
in momentum following a recovery attempt that falls short of Fri's 2.8172 high
that would be considered the next reinforcing factor to a count calling that
2.8172 high the prospective end to the month-and-a-half 2nd-Wave
correction. In lieu of such, a resumption of the current rally to
eventual new highs above 2.8172 should not surprise.