Orion Multi-Trader is a high-performance, multi-asset, broker-neutral platform for sophisticated investors. A powerful analysis and trading tools that enables you to design, execute and manage automated order strategies with ease.
Easy order management directly from Charts, Price Ladder or Quotes
Technical indicators with Orion MT’s advanced charts
Design, execute and manage automated order strategies with ease
Simulated trading environment
The Markets
Metals - Don’t Bail on Gold Just Yet
Don’t Bail on Gold Just Yet
By: Joshua GravesPosted 09/13/2019
December gold has seen volatility kick up quite a bit over the past few weeks. After the enormous rally through 1550, gold appears to have lost a bit of steam with a move back down to 1500 in recent sessions. Even though the stock market appears to be chugging along just fine toward the record high once again, shrugging off market concerns of a recession. The past 24 hours for gold has been quite exciting with the quick $30 pop up to 1532, only to quickly retreat back to 1507 on the close. This was due to the ECB cutting rates once again to negative territory at -.5%, along with $20B in monthly bond purchases as the Eurozone restarts their QE program. Europe is growing at 1% right now which is less than half the pace of the U.S. economy, a bullish development for gold. The trade war with China and the U.S. isn’t going anywhere, despite hope for an “interim” deal or talks in early October. There are too many thorny issues that will prevent a deal in the short term, and China will continue to try and delay any meaningful talks as tariffs are likely to be increased.
The one and only thing that I believe would be holding gold back and potentially trigger a washout below 1490 is the managed money position in the market being at an all-time record long 289,000 contracts. This is quite sizeable, and a lot of the buying power might be factored into the market already. If we hold 1500 and continue to make healthy moves higher in gold we should be okay and move toward 1600, and if managed money puts the foot on the brake we could be in for some real pain down to 1460 as the next stop.
Metals - Silver Rally Pauses but Has It Stopped?
Silver Rally Pauses but Has It Stopped?
By: Eric ScolesPosted 09/13/2019
Dec ’19 silver futures are trading in the same narrow range they have been since September 9th as the rally pauses and global anxiety seems to stabilize. Silver prices have been supported by a softening dollar index and bullish ECB news. As the fear of recession fades and the trade war simmers down the confidence in other markets, it puts pressure on the top heavy precious metals. Bears are cautious to be short on silver though because a single tweet could wipe out the positive tone in other markets. Silver according to my analysis is still undervalued compared to gold, which could provide opportunity for the bulls.
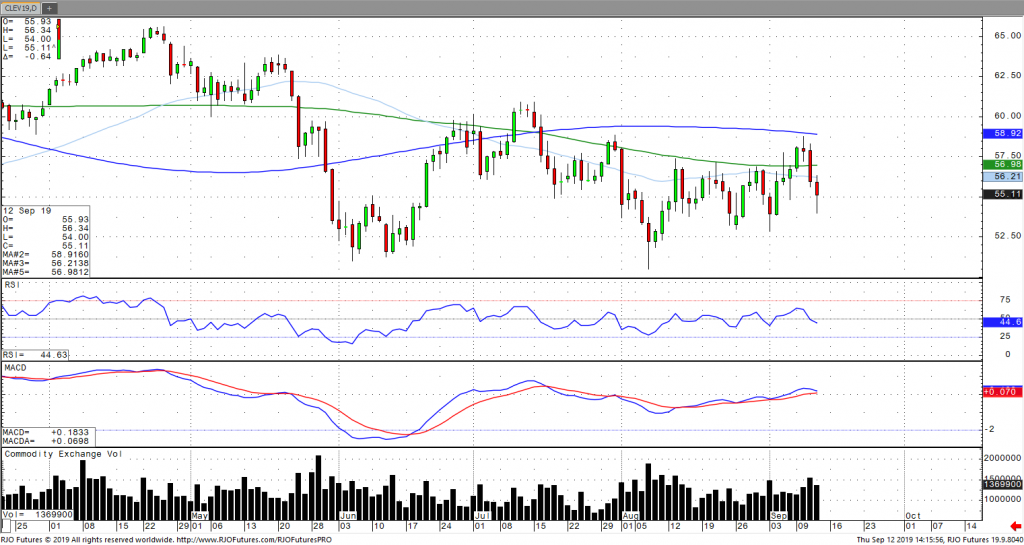
Crude oil has continued its long liquidation from Tuesday’s high following the removal of U.S. National Security Advisor and war hawk, John Bolton, which relieved Middle Eastern anxiety and subsequently prompted speculation of an increase in Iranian crude oil exports through sanction relief. OPEC, in their monthly report, adjusted their 2020 global demand forecast from 1.14 million to 1.08 million barrels a day (bpd) amid a continued slowdown in global growth. In addition, OPEC advised oil producing nations to continue curtailing production in order to avert a global glut. This comes amidst the EIA revising their 2019 world demand growth by 120,000 bpd and their 2020 forecast by 30,000 bpd. U.S. oil production forecast was downgraded to from 1.28 to 1.25 million bpd notwithstanding the U.S. becoming the world’s largest oil exporter, surpassing both Russia and Saudi Arabia, amid record shale production. However, with expectations of tempered demand growth and lower economic expectations coupled with ongoing geopolitical risks, oil prices are set for extended near term volatility. The market in the early session was signaling immediate term oversold but remains bearish trend with today’s range seen between 53.89 – 58.32.
If you have any questions or would like to discuss the markets further, please feel free to contact me at 800-438-4805 or aturro@rjofutures.com. Softs - Sugar’s Falling Knife Becomes Upside Spike?
Sugar’s Falling Knife Becomes Upside Spike?
By: Joe NikrutoPosted 09/13/2019
This week’s comment finds sugar again carving out new lows
for the move. The March ’20 contract has traded below 12.00 at the time of this
writing and it is difficult to see what might halt the decline. Near- term
supplies are ample, and talk of 2020 production deficits are falling on deaf
ears so far. It doesn’t take much
imagination to see sugar continuing to have trouble finding support. In recent
years, sugar has found support at these levels and at this size of market
participant position. The fund trader short position is record large and the
funds have shown a propensity to cycle out of positions when they reach this
level, moving the market to the upside.
Wire services and commentators continue to pitch next year’s deficit projections. If production declines do happen then higher prices will be in order. Until then, the market must contend with abundant upfront supply and a technical picture with no lower boundary. Trend follower stops are almost a full 100 points overheard. For March sugar, the 18-day moving average comes in at 12.23 and the 50-day at 12.70. Don’t expect the March sugar futures contract will require a real fundamental to turn and head for the moving averages. Positioning for a move to the 50-day moving average, 12.70 in the March contract, with shorter timeframe options could be a lower-risk way to play.
Softs - Coffee Futures Continue to Rally
Coffee Futures Continue to Rally
By: Eric ScolesPosted 09/11/2019
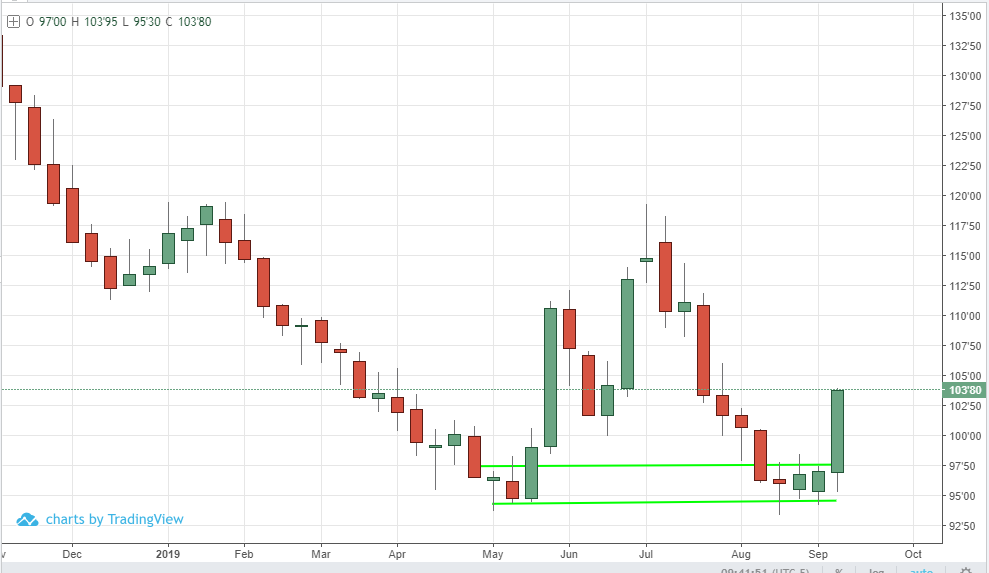
Dec ’19 coffee continue to rally for a second day after closing above the range it had been consolidating in on Monday. Managed funds are still heavily net short on this commodity and could provide a significant amount of fuel to rising prices by simply covering their shorts and stepping to the sidelines. My analysis suggests we could see Dec ’19 coffee reach up to 118’00 again this fall with strong support from both supply and demand aspects in the fundamentals. Dry weather in Brazil currently could impact the coffee trees ability to flower which may stress impact the next production season as well. If the fundamentals continue on a bullish track and inspire managed money funds to convert from today’s shorts into tomorrow’s longs, coffee could become a full-blown bull market.
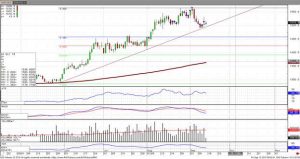
On
the heels of mid-Sep-to-early-Oct's steeper, accelerated, 3rd-wave-looking
recovery, the past week-and-a-half's boringly lateral chop is first considered
a corrective/consolidative event that warns of a continuation of the uptrend
that preceded it to new highs above 04-Oct's 891.0 high. This count
remains consistent with our broader base/correction/recovery count introduced
in 13-Sep's Technical Blog following that
day's bullish divergence in short-term momentum above 07-Sep's 809.5 minor
corrective high detailed in the hourly chart below.
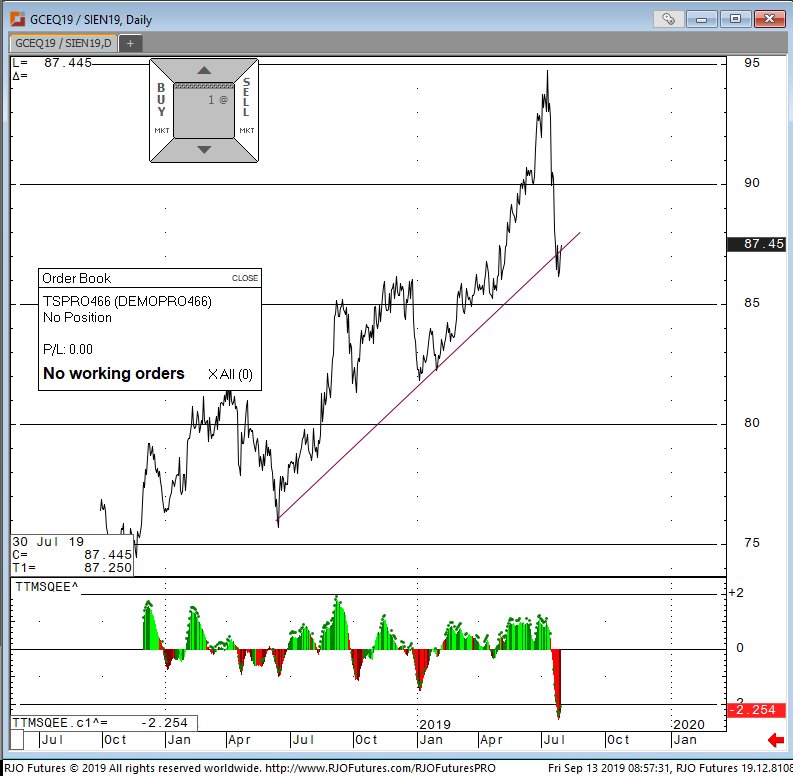
The
important takeaway from this month's lateral, sleepy price action is the
definition of Wed's 851.5 low as
the end or lower boundary of a suspected 4th-Wave correction. A failure
below 851.5 will confirm a bearish divergence in daily momentum and defer or
threaten a bullish count enough to warrant non-bullish decisions like
long-covers. A failure below 851.5 will not
necessarily negate a broader bullish count, but it will threaten it enough to
warrant defensive measures as the next pertinent technical levels below 851.5 are
13-Sep's prospective minor 1st-Wave high at 813.8 and obviously 08-Sep's 766.0
low. And making non-bullish decisions "down there" is
sub-optimal to say the least. Per such, both short- and longer-term
commercial traders are advised to pare or neutralize bullish exposure on a
failure below 851.5, acknowledging and accepting whipsaw risk- back above 04-Oct's
891.0 high- in exchange for much deeper and sub-optimal nominal risk below
766.0.
On
a broader scale, the daily log scale chart above shows the developing potential
for a bearish divergence in daily momentum that will be considered confirmed
below 851.5. This chart also shows the past month's recovery thus far
stalling in the immediate neighborhood of the (888.0) Fibonacci
minimum 38.2% retrace of Apr-Sep's entire 1128 - 766 decline). COMBINED
with a failure below 851.5, traders
would then need to be concerned with at least a larger-degree correction pf the
past month's rally and possibly a resumption of Apr-Sep's major downtrend.
Until
and unless the market fails below 851.5 however, we would
remind longer-term players of the key elements on which our bullish count is
predicated:
a confirmed bullish divergence in WEEKLY momentum
(below)
amidst
an
historically low 11% reading in out RJO Bullish Sentiment Index and
a
textbook complete and major 5-wave Elliott sequence down from 29-Apr's
1128 high to 08-Sep's 766.0 low.
Thus
far, the market is only a month into correcting a 4-MONTH, 32% drawdown, so
further and possibly protracted gains remain well within the bounds of a major
(suspected 2nd-Wave) correction of Apr-Sep's decline within an even more
massive PEAK/reversal process from 17-May's 1219 high on an active continuation
basis below.
These
issues considered, a bullish policy and exposure remain advised with a failure
below 851.5 required to defer or threaten this call enough to warrant moving to
a neutral/sideline position. In lieu of such weakness, we anticipate a
continuation of the past month's rally to new highs and potentially significant
gains above 891.0.
Agricultural - Slightly Bearish News, Still Gets a Bounce in Corn; Priced In?
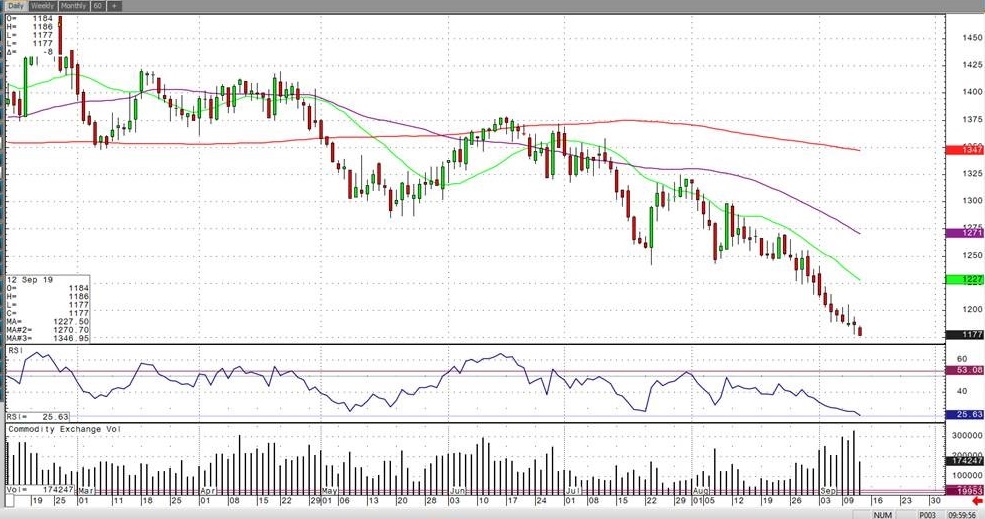
Slightly Bearish News, Still Gets a Bounce in Corn; Priced In?
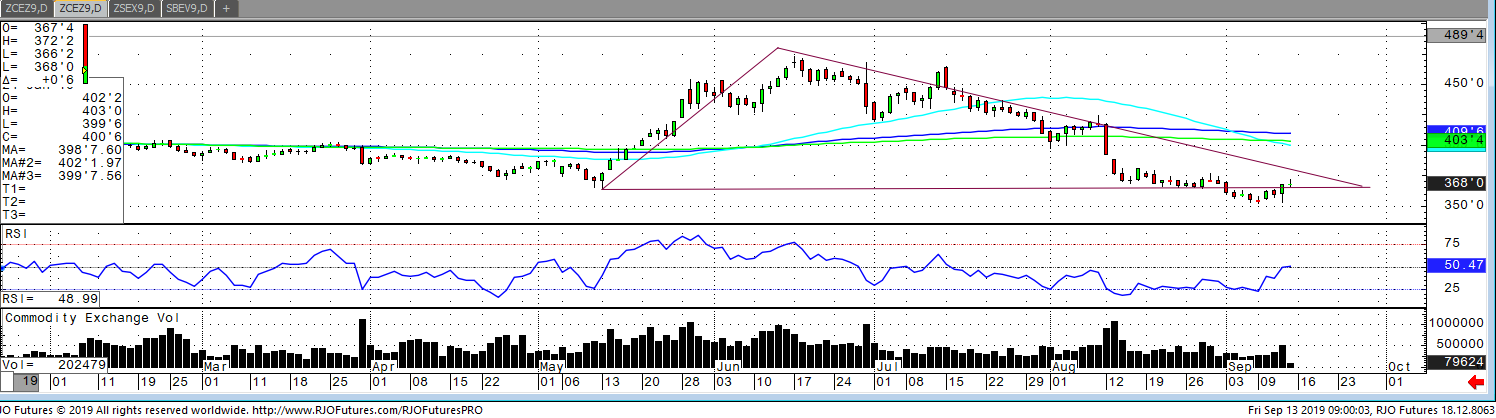
December corn had an impressive day after a slightly bearish report, closing higher and following through this morning. The USDA report showed yields at 168.2, compared to estimates around 167, but still dropped from August report of 169+. Projected 82 million harvested acres remained unchanged from August but remained higher than estimates of 81.3 million acres. The USDA increased ending stocks by 85 million bushels by lowering ethanol usage by 50 million bushels and exports 25 million bushels. Corn imports were lowered by 5 Million. When you see a market rally on bearish news, it’s a pretty clear sign that these numbers were already priced in and may have been pricing in even more bearish numbers than we received. Last year, the September report raised yield by 5bpa and within 5 days the seasonal lows were put in. Resistance is around 374 and 378 today with support coming in at 360 and then all the way down at 349.
If you have any questions or would like to discuss the markets further, please feel free to contact me at 800-826-2270 or tcholly@rjofutures.com. Agricultural - Turnaround In Cattle Market
Turnaround In Cattle Market
By: Peter McGinnPosted 09/11/2019
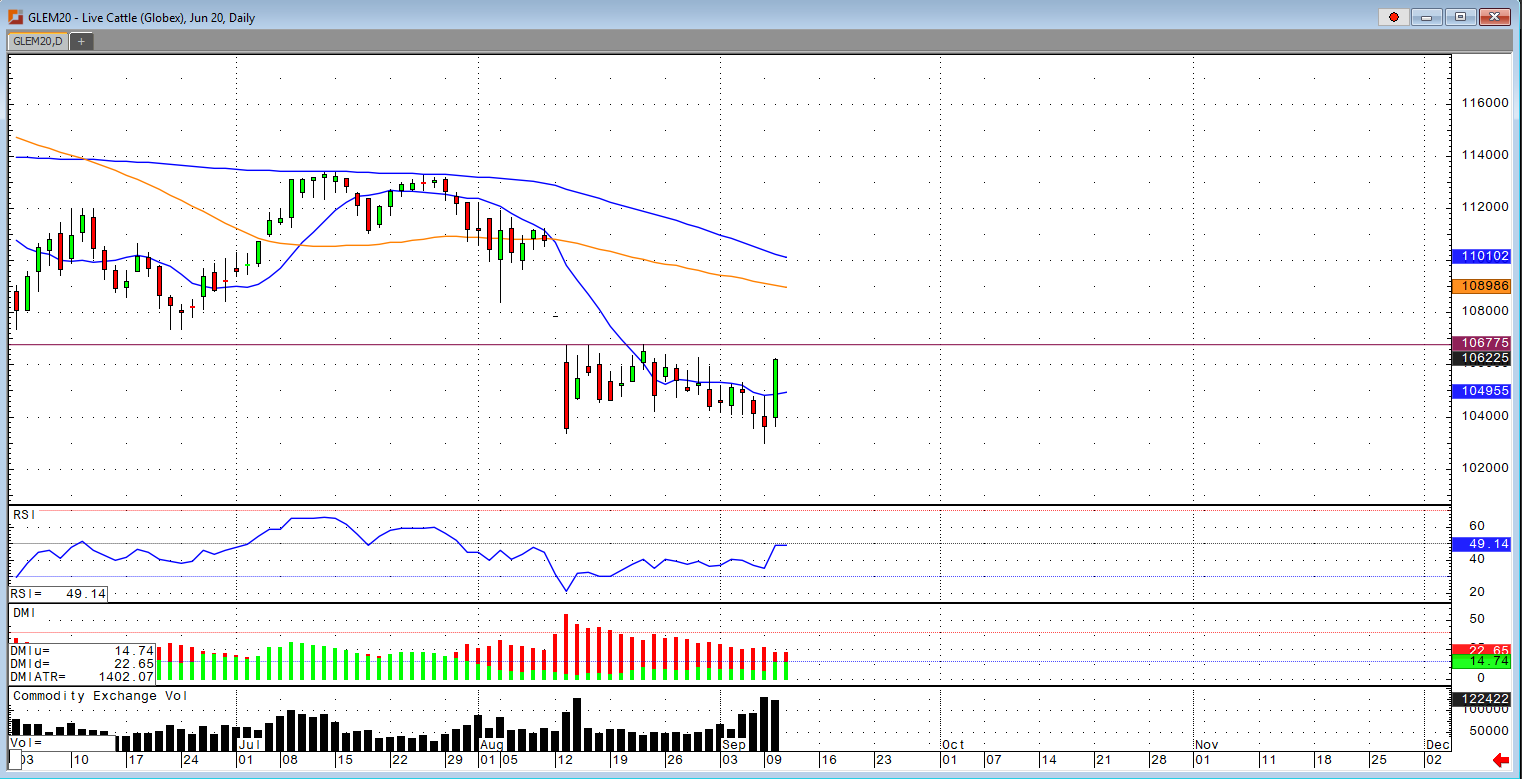
The cattle market saw a strong turn around yesterday with June cattle gaining $2, finishing at $106.225. The sense of a break being overdone, along with a record packer margin helping to stabilize the cash market is what seems to have been the catalyst to help spark the turnaround in futures. December cattle tried to break through the $99 level, but failed to do so and had a strong turn around to the upside. There were more rumors coming out of China that they will extend an olive branch by lifting tariffs on agriculture products which also helped spark the buying in the market. The June contract is at a resistance level right now, but if there is no negative news for the rest of the week, I suspect this market to have some follow through today and try to fill the gap the rest of this week into next. If we trade above the August 22nd high of $106.775, I would see this as confirmation as a turnaround in the beef market. The USDA estimated cattle slaughter came in at 116,000 head yesterday. This brings the total for the week so far to 231,000 head, up from 116,000 last week (which was shortened by the holiday on Monday) and down from 239,000 a year ago. USDA boxed beef cutout values were down 63 cents at mid-session yesterday and closed $1.57 lower at $225.38. This was down from $230.66 the previous week. Only a small amount of cattle traded in the cash market Monday but at lower prices than last week, with Iowa/Minnesota at $97.00 and some cattle in Nebraska at $97.00 as well. Nebraska traded as high as $109.50 back on August 22nd.
Currency - Investors Flea from Safe-Haven: USD in Topping Process
Investors Flea from Safe-Haven: USD in Topping Process
By: Ian BannonPosted 09/13/2019
September U.S. dollar futures are down another
28-points Friday morning after Thursday’s selloff from the 99 level. Proceeding
the ECB meeting yesterday, dollar futures soared while the euro slid to new
contract lows on news that Europe’s central bank cut their benchmark interest
rate another 10 bps to -0.5% and agreed to buy $22 bn worth of bonds each month
starting in November. This level of stimulus is an attempt to keep recession at
bay in an economy that is clearly feeling the impact of President Trump’s
tariff war. However, currency markets were quick to reverse the initial
reaction to stimulus, with euro futures trading back above 1.11 Friday morning.
From a technical perspective, the euro appears to be near a bottom given last
week’s morning star reversal pattern on the chart. Adding support to this
theory is that the U.S. dollar showed an evening star pattern on its daily
chart last week and has since failed to move above that high. Fundamentally
speaking, this makes sense.
European rates are negative, indicating that they do
not have much more room to cut (10 bps is hardly a sizeable reduction). On the
contrary, U.S. rates are not only positive, but are substantially higher than
rates in other developed economies. Therefore, the Fed has more “bullets in the
chamber” when it comes to rate cuts as a means of stimulus. The U.S. dollar
index is weighted against six other major currencies, most heavily the euro.
This points to a topping in the U.S. dollar, likely in October, and
simultaneously a bottom in the euro.
Meanwhile, the yen is seeing stronger sell-offs. Its purpose as a safe-haven currency is no longer attractive to investors because of the easing in economic uncertainty. Last week, Donald Trump announced a resumption of China trade talks which put global markets at ease. Sound familiar? Waters seems to be warming between the two economic superpowers, but I still do not believe a trade deal is imminent. China believes they’ll get a better deal with a different president, so they’ll try to postpone a deal so long as there is still hope of a competent democratic challenger. Until then, expect volatility.
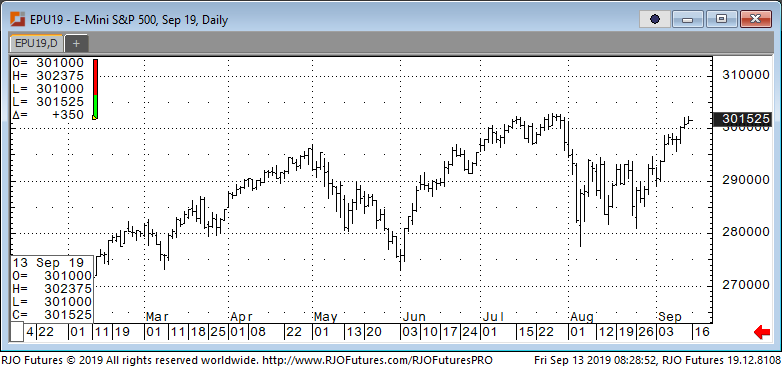
Equity - A Little Chit-Chat and a Lot of Spending Rallies the Market.
A Little Chit-Chat and a Lot of Spending Rallies the Market.
Stock futures are
looking to open higher on Friday with growing optimism on the trade talks
between the U.S. and China, along with a domestic retail sales number that
exceeded expectations. President Trump calmed the markets Thursday by tweeting,
“It is expected that China will be buying large amounts of our agricultural
products.”
China’s Xinhua News Agency corroborated this Friday morning buy saying that “The Chinese government is encouraging companies to buy a certain amount of farm products including pork and soybeans and will exempt these goods from additional tariffs”. A measure of retail sales rose at a better-than-expected rate this month, this was led by sales from internet retailers, building materials and auto dealers. The Commerce Department reported today that retail sales rose .04% in August doubling the expected .02% gain.
Resistance is setting in at 302100 and 303300, with support being 300000 and 299000.
If you have any questions or would like to discuss the markets further, please feel free to contact me at 888-861-1656 or jyasak@rjofutures.com. Economy - S-T Mo Failure Insufficient to End RBOB Correction, But Beware
S-T Mo Failure Insufficient to End RBOB Correction, But Beware
By: RJO Market InsightsPosted 11/08/2022
Posted on Nov 08, 2022, 07:51 by Dave Toth
In Fri's Technical Webcast we identified a
minor corrective low at 2.6328 from Thur as a mini risk parameter the market
needed to sustain gains above to maintain a more immediate bullish count.
The 240-min chart below shows the market's failure overnight below this level,
confirming a bearish divergence in very short-term momentum. This mo
failure defines Fri's 2.8172 high as
one of developing importance and a parameter from which very short-term traders
can objectively base non-bullish decisions like long-covers.
Given
the magnitude of the past three weeks' broader recovery however, this
short-term momentum failure is of an insufficient scale to conclude anything
more than another correction within this broader recovery from 26-Sep's 2.1877
low. Indeed, overnights failure below 2.6328 only allows us to conclude
the end of the portion of the month-and-a-half rally from 31-Oct's 2.4822 next
larger-degree corrective low. 2.4822 is the
risk parameter this market still needs to fail below to break the uptrend from
18-Oct's 2.3526 low while this 2.3526 low
remains intact as the risk parameter this market needs to fail below to break
the month-and-a-half uptrend. From an
intermediate-to-longer-term perspective, this week's setback falls well within
the bounds of another correction ahead of further gains. This is another
excellent example of the importance of technical and trading SCALE and
understanding and matching directional risk exposure to one's personal risk
profile.
The
reason overnight's admittedly minor mo failure might have longer-term
importance is the 2.8172-area from which it stemmed. In
Fri's Technical Blog we also noted the market's engagement of the
2.8076-to-2.8159-area marked by the 61.8% retrace of Jun0-Sewp's 3.2758 -2.1877
decline and the 1.000 progression of Sep-Oct's initial 2.1877 - 2.6185
(suspected a-Wave) rally from 18-Oct's 2.3526 (suspected b-Wave) low. We
remind longer-term players that because of the unique and compelling confluence
of:
early-Aug's bearish divergence in WEEKLY momentum
amidst
historically
extreme bullish sentiment/contrary opinion levels in our RJO Bullish
Sentiment Index
an
arguably complete and massive 5-wave Elliott sequence from Mar'20's 0.4605
low to Jun's 4.3260 high (as labeled in the weekly log active-continuation
chart below) and
the
5-wave impulsive sub-division of Jun-Sep's (suspected initial 1st-Wave) decline
The
recovery attempt from 26-Sep's 2.1877 low is arguably only a 3-wave (Wave-2)
corrective rebuttal to Jun-Sep's decline within a massive, multi-quarter
PEAK/reversal process. Now granted, due to the magnitude of 2020 -2022's
secular bull market, we discussed the prospect for this (2nd-Wave corrective)
recovery to be "extensive" in terms of both price and time. A
"more extensive" correction is typified by a retracement of 61.8% or
more and spanning weeks or even months following a 3-month decline. Per
such, the (suspected corrective) recovery from 26-Sep's 2.1877 low could easily
have further to go, with commensurately larger-degree weakness than that
exhibited this week (i.e., a failure below at least 2.4822) required
to consider the correction complete. Indeed, the daily log chart above
shows the market thus far respecting former 2.6185-area resistance from 10-Oct
as a new support candidate.
These
issues considered, very shorter-term traders have been advised to move to a neutral/sideline
position following overnight's momentum failure below 2.6328, with a recovery
above 2.8172 required to negate this call, reaffirm the recovery and re-expose
potentially significant gains thereafter. For intermediate- and
longer-term players, a bullish policy and exposure remain advised with a
failure below 2.4822 required to threaten this call enough to warrant
neutralizing exposure. We will be watchful for another bearish divergence
in momentum following a recovery attempt that falls short of Fri's 2.8172 high
that would be considered the next reinforcing factor to a count calling that
2.8172 high the prospective end to the month-and-a-half 2nd-Wave
correction. In lieu of such, a resumption of the current rally to
eventual new highs above 2.8172 should not surprise.