RJO FuturesCast

September 27, 2019 | Volume 13, Issue 39

The Markets

Metals - Gold Should Hold, Look for A Bounce

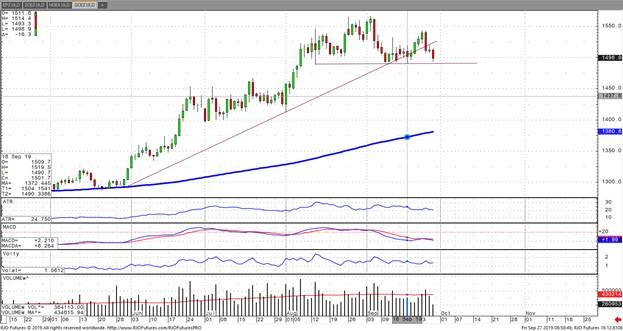
December gold has been under quite a bit of pressure the past few days. Even as I write this, gold is down another $20 sitting right at the lows around $1493. The stock market seemed to shrug off the Trump impeachment inquiry, and combined with some recent healthy economic data, has back tracked a bit. This morning’s durable goods orders that came in above expectations and stocks have been holding which is adding to the pressure. In my opinion, this is an area where traders should look where gold was at the beginning of September, and look at the value at those levels. There are a few reasons why we should hold around $1490. The first and most obvious is the big picture theme of uncertainty over the upcoming trade talks, where a breakthrough is highly unlikely. At best I think we will see, an “agree to disagree, let’s keep talking” outcome. This is likely, given the very thorny issues that have not been addressed such as property theft and forced technology transfers. The second main reason to look at buying gold at these levels is the central bank buying around the world continues to be seen, and that theme isn’t going anywhere given the uncertainty in Europe as interest rates continue to dive.

The one thing to consider should gold move below $1490 is how far it could go before heavy buyers come back to shore it up. Managed money in the gold market is what speculators should watch, and traders should consider the all-time record long position of 290,000+ contracts long gold. The door has not got any bigger for those who run for the exits should gold break this key support area of $1490. Traders should start positioning long using a combination of options and futures. If you would like more information on how to trade gold on this pullback, contact me directly.

Metals - Silver Breaks Down Below Support

Dec ’19 silver breaks down below support as the precious metals pull back from their late summer highs. The lack of bullish sensitivity to many recent geo-political concerns from impeachment talks to explosive sabotage on Saudi oil production is concerning for the bulls. There is still support from fundamentals in that ETFs have continued to add to their holdings and seasonal gold purchases from India may drive gold up and support silver. From a technical perspective though, the chart damage is currently significant, and prices have fallen below what seems to be an important level. You’ll note on the weekly chart that the price level of about 17’555 seems to divide between bull and bear trends since at least 2015. While It’s possible that it may just be a bull flag before the next rally, I’d recommend a high level of caution to bulls if prices remain below that level.

Energy - Oil Prices Soften but Risk Remains High

Oil prices have continued to move lower amidst the second weekly surprise build in inventories and have softened back to their pre-attack levels following the attack on the Saudi Arabian oil facilities.  Aramco has reported that output has improved to 8-million barrels per day, although the figure appears overstated and the projected timeline optimistic with full production capacity viewed at 12.5 million barrels per day. Although U.S. production has matched record levels of 12.4 million barrels per day and despite Iraq, UAE and perhaps Russia being able to add production, Saudi Arabia is the central spare capacity provider pending any subsequent attack or supply disruption. While global demand concerns continue to persist, geopolitical risk remains high and far from diffused with Iranian pressure increasing with the EU now condemning the attack. The market remains bearish trend with today’s range seen between 54.00 – 62.36 with trend resistance seen around 58.44.

If you have any questions or would like to discuss the markets further, please feel free to contact me at 800-438-4805 or aturro@rjofutures.com.
Softs - Corrective Rally in Sugar or Price Floor Located?

This week’s comment finds the now prompt March sugar futures contract rallying in convincing fashion.  With the size of the fund trader short position, March sugar could travel a bit of distance to the upside before losing steam. The level of short interest we have seen on the part of the fund trader is often followed by a cycling out of those short positions. This getting to the sidelines/ booking profits is enough to hold sway over price action for days and even weeks. Those who have been watching sugar for any length of time will agree that it can be markedly unprofitable to stand in the way of these moves. I do not believe that sugar has the fundamentals to hold a change of direction and establish a new uptrend.  But if the funds keep covering shorts, and they have plenty to cover, the fundamentals will take a back seat for a time.  Wire services continue to advertise the future math needed to estimate potential supply deficits. It could very well be that production will be lacking in 2019/2020. China could also be on the bid lining up imports. These are fundamentals that will become obvious later. For now, we only have the chart to go on. The chart for March sugar points higher.

Agricultural - Bullish Canola Count Intact Above Minimum 851.5

Posted on Oct 14, 2022, 07:42 by Dave Toth

On the heels of mid-Sep-to-early-Oct's steeper, accelerated, 3rd-wave-looking recovery, the past week-and-a-half's boringly lateral chop is first considered a corrective/consolidative event that warns of a continuation of the uptrend that preceded it to new highs above 04-Oct's 891.0 high.  This count remains consistent with our broader base/correction/recovery count introduced in 13-Sep's Technical Blog following that day's bullish divergence in short-term momentum above 07-Sep's 809.5 minor corrective high detailed in the hourly chart below.

The important takeaway from this month's lateral, sleepy price action is the definition of Wed's 851.5 low as the end or lower boundary of a suspected 4th-Wave correction.  A failure below 851.5 will confirm a bearish divergence in daily momentum and defer or threaten a bullish count enough to warrant non-bullish decisions like long-covers.  A failure below 851.5 will not necessarily negate a broader bullish count, but it will threaten it enough to warrant defensive measures as the next pertinent technical levels below 851.5 are 13-Sep's prospective minor 1st-Wave high at 813.8 and obviously 08-Sep's 766.0 low.  And making non-bullish decisions "down there" is sub-optimal to say the least.  Per such, both short- and longer-term commercial traders are advised to pare or neutralize bullish exposure on a failure below 851.5, acknowledging and accepting whipsaw risk- back above 04-Oct's 891.0 high- in exchange for much deeper and sub-optimal nominal risk below 766.0.

On a broader scale, the daily log scale chart above shows the developing potential for a bearish divergence in daily momentum that will be considered confirmed below 851.5.  This chart also shows the past month's recovery thus far stalling in the immediate neighborhood of the (888.0) Fibonacci minimum 38.2% retrace of Apr-Sep's entire 1128 - 766 decline).  COMBINED with a failure below 851.5, traders would then need to be concerned with at least a larger-degree correction pf the past month's rally and possibly a resumption of Apr-Sep's major downtrend.

Until and unless the market fails below 851.5 however, we would remind longer-term players of the key elements on which our bullish count is predicated:

  • a confirmed bullish divergence in WEEKLY momentum (below) amidst
  • an historically low 11% reading in out RJO Bullish Sentiment Index and
  • a textbook complete and major 5-wave Elliott sequence down from 29-Apr's 1128 high to 08-Sep's 766.0 low.

Thus far, the market is only a month into correcting a 4-MONTH, 32% drawdown, so further and possibly protracted gains remain well within the bounds of a major (suspected 2nd-Wave) correction of Apr-Sep's decline within an even more massive PEAK/reversal process from 17-May's 1219 high on an active continuation basis below.

These issues considered, a bullish policy and exposure remain advised with a failure below 851.5 required to defer or threaten this call enough to warrant moving to a neutral/sideline position.  In lieu of such weakness, we anticipate a continuation of the past month's rally to new highs and potentially significant gains above 891.0.

Agricultural - Grain Futures Update w/Stephen Davis - 09/27/2019
RJO Futures Senior Market Strategist Stephen Davis discusses the grain futures markets.  If you have any questions or would like to discuss the markets further, please feel free to contact me at 800-367-7181 or sdavis@rjofutures.com.
Agricultural - Live Cattle Down, Despite Bullish Reports

Last Friday’s cattle on feed report was a bullish report which showed that actual placements for the month of August were down 9% from last year vs. trade expectations for down 5.9% from last year. This leaves September 1st on-feed supply down 1.3% from last year and trade expectations down 0.7% from last year. Trade reflected these numbers on Monday’s session and early Tuesday before a bearish technical signal showed itself yesterday, with an outside down day along with a turn in consumer confidence added to the already bearish tone. The trade negotiations could cause some short selling in the market today.

December cattle reached its highest level since August 9th before doing a hook reversal, another bearish chart pattern. The weakness in the beef market has also brought some cause for concern in terms of demand. USDA boxed beef cutout values were down 93 cents at mid-session yesterday and closed $1.06 lower at $215.39. This was down from $219.77 the prior week and is the lowest beef market since August 5th. The USDA estimated cattle slaughter came in at 117,000 head yesterday. This brings the total for the week so far to 233,000 head, down from 235,000 last week and down from 237,000 a year ago. The monthly cold storage report showed frozen beef stocks at the end of August at 469.38 million pounds, down 6.4% from last year but up 3.9% from July. Cold storage stocks normally show a slight increase for August, so the 3.9% increase is seen as bearish. We could see this market sell off for the rest of the week, but I still feel there is some good upside in the beef market, with little supply right now along with the technical gap in the market, I wouldn’t be surprised to see $112 to $115 December Cattle.

Currency - Bullish Fundamentals Send the USD to New Highs

 U.S. dollar futures moved modestly higher Friday morning, making a fresh contract high as investors embrace warming relations between the United States and other leading economic areas. Adding to the improved sentiment is an extremely bullish chart pattern and better-than-expected durable goods sales, coming in at 0.2% vs -1.2% consensus. European data overnight was weak again, bolstering the relative strength of the U.S. economy. This causes a domino effect for dollar strength because the prospects for another Fed rate cut this year are dwindling as surprisingly positive US data continues to impress investors.

The CME now forecasts only a 45% chance of a 25-bps cut at the October meeting. Without further monetary loosening by the Fed, the liquidity shortage will squeeze the dollar higher until quantitative easing is inevitably rolled out by the central bank. The only question is when will this happen and what will it take to force the Fed’s hand? Surely their ability to fend off recession is diminishing as rates move toward zero. They continuously put faith in the resilience of the U.S. consumer, but if they wait to roll out QE until the consumer is on the ropes, it may be too late.

The Japanese Yen is proving a failed rally as safe-haven risk is removed from markets. The British pound is in a period of correction after a 5-cent climb over the last month. Adding to the technical pressure is the mess of divided Parliament, as Boris Johnson joins his friend Donald Trump on the impeachment pyre. The Canadian dollar is holding up in the face of a bearish oil market, possibly riding the shirttails of the USD. Relatively speaking, all major currencies will likely remain depressed if the strength of the USD continues. Multiple bullish fundamentals are gripping the greenback, and it appears the only thing that can stop that train is our own central bank.

Equity - Pork, Beans, and Stocks

Stock futures are pointing higher on Friday morning with the U.S. and China planning to resume trade talks in mid-October.  A rally today would help offset the weekly losses for the stock indexes.  The S&P, Nasdaq and Dow were all headed to end the week lower snapping a three-week winning streak.  The hope is that the two countries can end the tariff war which has seen both imposing billions of dollars’ worth of taxes on each other’s imports.  According to the Ministry of Commerce, some Chinese importers have made deals to buy American soybeans and pork to show goodwill before the talks. “A favorable development on the trade front -- that would be the biggest catalyst at this point” to drive equities higher, Brian Jacobsen, multi-asset strategist at Wells Fargo Asset Management, told Bloomberg TV. “We seem to be just waiting and seeing” until the high-level U.S.-China talks next month, he said.

Support today is 296400 and 294800 while resistance is showing 299600 and 301200.

If you have any questions or would like to discuss the markets further, please feel free to contact me at 888-861-1656 or jyasak@rjofutures.com.
Economy - S-T Mo Failure Insufficient to End RBOB Correction, But Beware

Posted on Nov 08, 2022, 07:51 by Dave Toth

In Fri's Technical Webcast we identified a minor corrective low at 2.6328 from Thur as a mini risk parameter the market needed to sustain gains above to maintain a more immediate bullish count.  The 240-min chart below shows the market's failure overnight below this level, confirming a bearish divergence in very short-term momentum.  This mo failure defines Fri's 2.8172 high as one of developing importance and a parameter from which very short-term traders can objectively base non-bullish decisions like long-covers.

Given the magnitude of the past three weeks' broader recovery however, this short-term momentum failure is of an insufficient scale to conclude anything more than another correction within this broader recovery from 26-Sep's 2.1877 low.  Indeed, overnights failure below 2.6328 only allows us to conclude the end of the portion of the month-and-a-half rally from 31-Oct's 2.4822 next larger-degree corrective low.  2.4822 is the risk parameter this market still needs to fail below to break the uptrend from 18-Oct's 2.3526 low while this 2.3526 low remains intact as the risk parameter this market needs to fail below to break the month-and-a-half uptrend.  From an intermediate-to-longer-term perspective, this week's setback falls well within the bounds of another correction ahead of further gains.  This is another excellent example of the importance of technical and trading SCALE and understanding and matching directional risk exposure to one's personal risk profile.

The reason overnight's admittedly minor mo failure might have longer-term importance is the 2.8172-area from which it stemmed.  In Fri's Technical Blog we also noted the market's engagement of the 2.8076-to-2.8159-area marked by the 61.8% retrace of Jun0-Sewp's 3.2758 -2.1877 decline and the 1.000 progression of Sep-Oct's initial 2.1877 - 2.6185 (suspected a-Wave) rally from 18-Oct's 2.3526 (suspected b-Wave) low.  We remind longer-term players that because of the unique and compelling confluence of:

  • early-Aug's bearish divergence in WEEKLY momentum amidst
  • historically extreme bullish sentiment/contrary opinion levels in our RJO Bullish Sentiment Index
  • an arguably complete and massive 5-wave Elliott sequence from Mar'20's 0.4605 low to Jun's 4.3260 high (as labeled in the weekly log active-continuation chart below) and
  • the 5-wave impulsive sub-division of Jun-Sep's (suspected initial 1st-Wave) decline

The recovery attempt from 26-Sep's 2.1877 low is arguably only a 3-wave (Wave-2) corrective rebuttal to Jun-Sep's decline within a massive, multi-quarter PEAK/reversal process.  Now granted, due to the magnitude of 2020 -2022's secular bull market, we discussed the prospect for this (2nd-Wave corrective) recovery to be "extensive" in terms of both price and time.  A "more extensive" correction is typified by a retracement of 61.8% or more and spanning weeks or even months following a 3-month decline.  Per such, the (suspected corrective) recovery from 26-Sep's 2.1877 low could easily have further to go, with commensurately larger-degree weakness than that exhibited this week (i.e., a failure below at least 2.4822) required to consider the correction complete.  Indeed, the daily log chart above shows the market thus far respecting former 2.6185-area resistance from 10-Oct as a new support candidate.

These issues considered, very shorter-term traders have been advised to move to a neutral/sideline position following overnight's momentum failure below 2.6328, with a recovery above 2.8172 required to negate this call, reaffirm the recovery and re-expose potentially significant gains thereafter.  For intermediate- and longer-term players, a bullish policy and exposure remain advised with a failure below 2.4822 required to threaten this call enough to warrant neutralizing exposure.  We will be watchful for another bearish divergence in momentum following a recovery attempt that falls short of Fri's 2.8172 high that would be considered the next reinforcing factor to a count calling that 2.8172 high the prospective end to the month-and-a-half 2nd-Wave correction.  In lieu of such, a resumption of the current rally to eventual new highs above 2.8172 should not surprise.

Coming Up Next Week...

View Futures Calendar