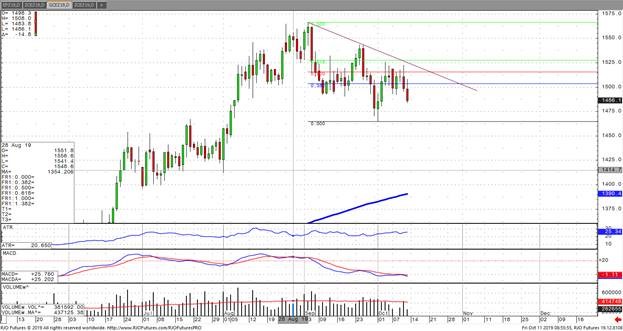
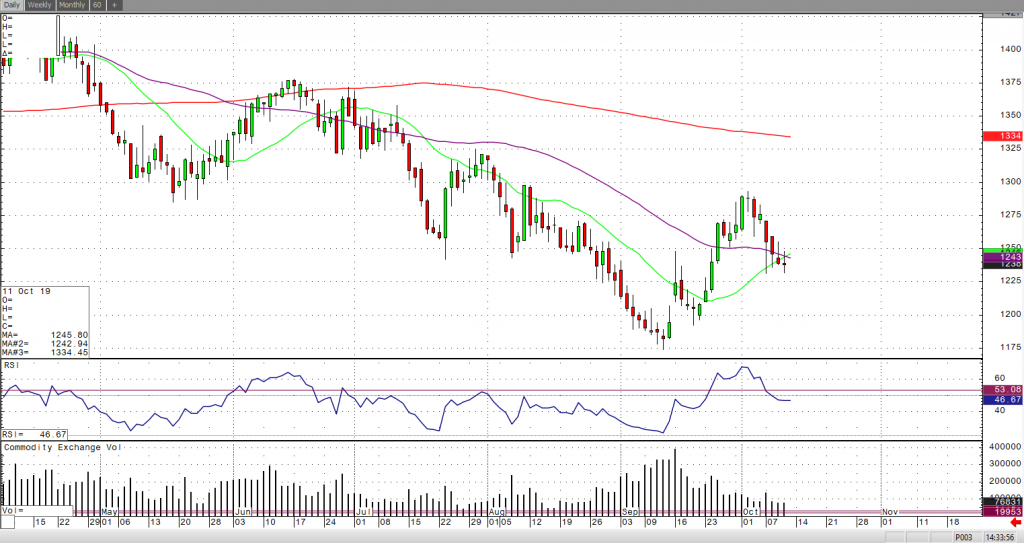
December gold has seen this move before, and the main themes driving it higher still have not changed. This time shouldn’t be traded any differently. There are a few short term themes that are driving it lower and the clear and obvious reasons are the increased chances of a Brexit deal, and the optimism surrounding the U.S./China trade talks which are wrapping up today. I would look at the longer-term themes as the real issues to consider when considering a long position in gold. The central banks around the world have been buying gold at a much more aggressive pace over the past 12 months, with China and Russia leading the way to split from the U.S. dollar. The yield curve invertingm which has preceded the last 7 recessions, might be worrisome for investors and a flight to safe havens would make sense.
Technically, gold is having real trouble breaking the short-term trend which was drawn from the high to the most recent trend line resistance point at 1522. I would be a buyer of gold lightly in the 1475 area, and even more so around 1450, but this is in terms of the value as we are almost $100 off the recent yearly contract high. To confirm a gold turnaround though, we really need a break above 1530, and 1544 respectively. This would break above the short term down trend we have been in, and give more confidence to the bulls as the growing uncertainty over the economy grows. If you would like more information on how to trade gold weather over the short term or long term please contact me directly.
Metals - Silver heading to $20.00?
Silver heading to $20.00?
By: Eli Tesfaye, Senior Market StrategistPosted Oct 11, 2019 8:56AM CT
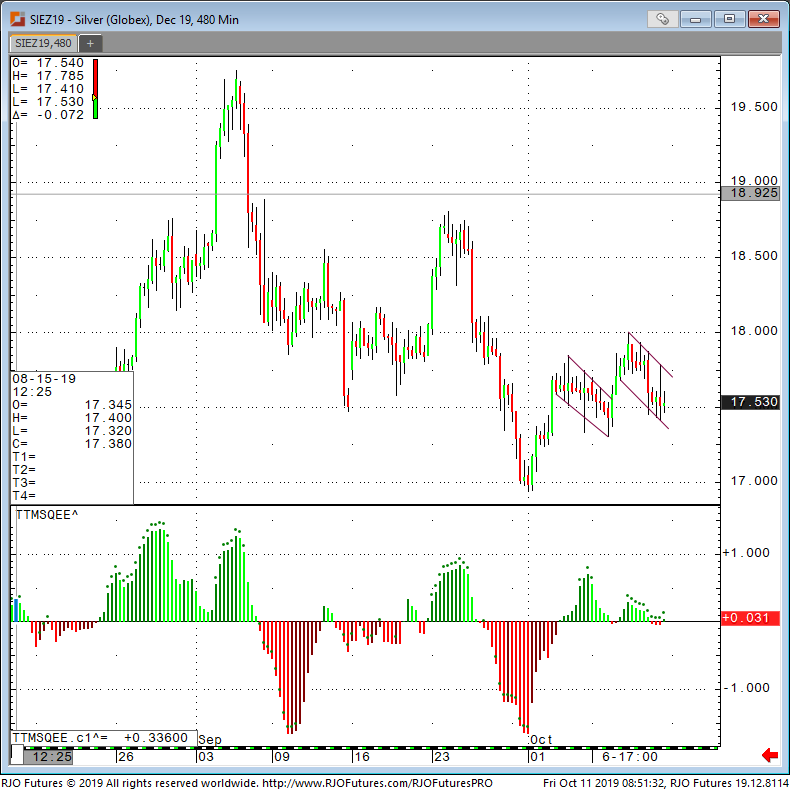
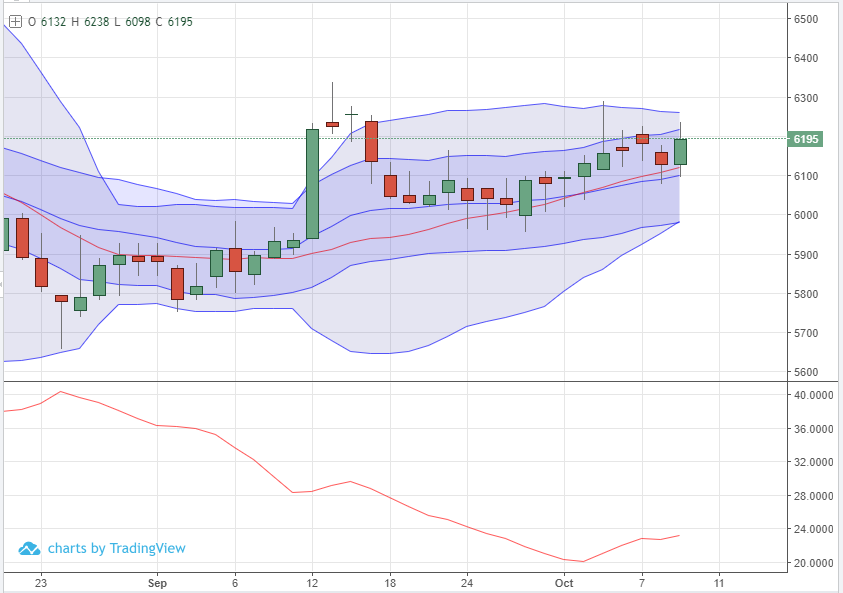
When comparing gold and silver, in my opinion, the silver
chart looks more bullish. Any sustained break in the U.S. dollar should send
silver shooting to $20.00 area. The headlines are very supportive. The month of
October may be a crucial month for U.S.-China trade talk. If that happens, it
could strengthen a Renminbi and send the dollar lower. Silver could benefit
from spillover effect. The U.S. political landscape is heating up as well.
From the technical prospective, a closer look of series of small flags suggest that more upside are likely.
If you have any questions or would like to discuss the markets further, please feel free to contact me at 800-367-7290 or etesfaye@rjofutures.com. Energy - Oil Rebounds with Risk Ongoing
Oil Rebounds with Risk Ongoing
By: Alexander Turro, Senior Market StrategistPosted Oct 11, 2019 7:36AM CT
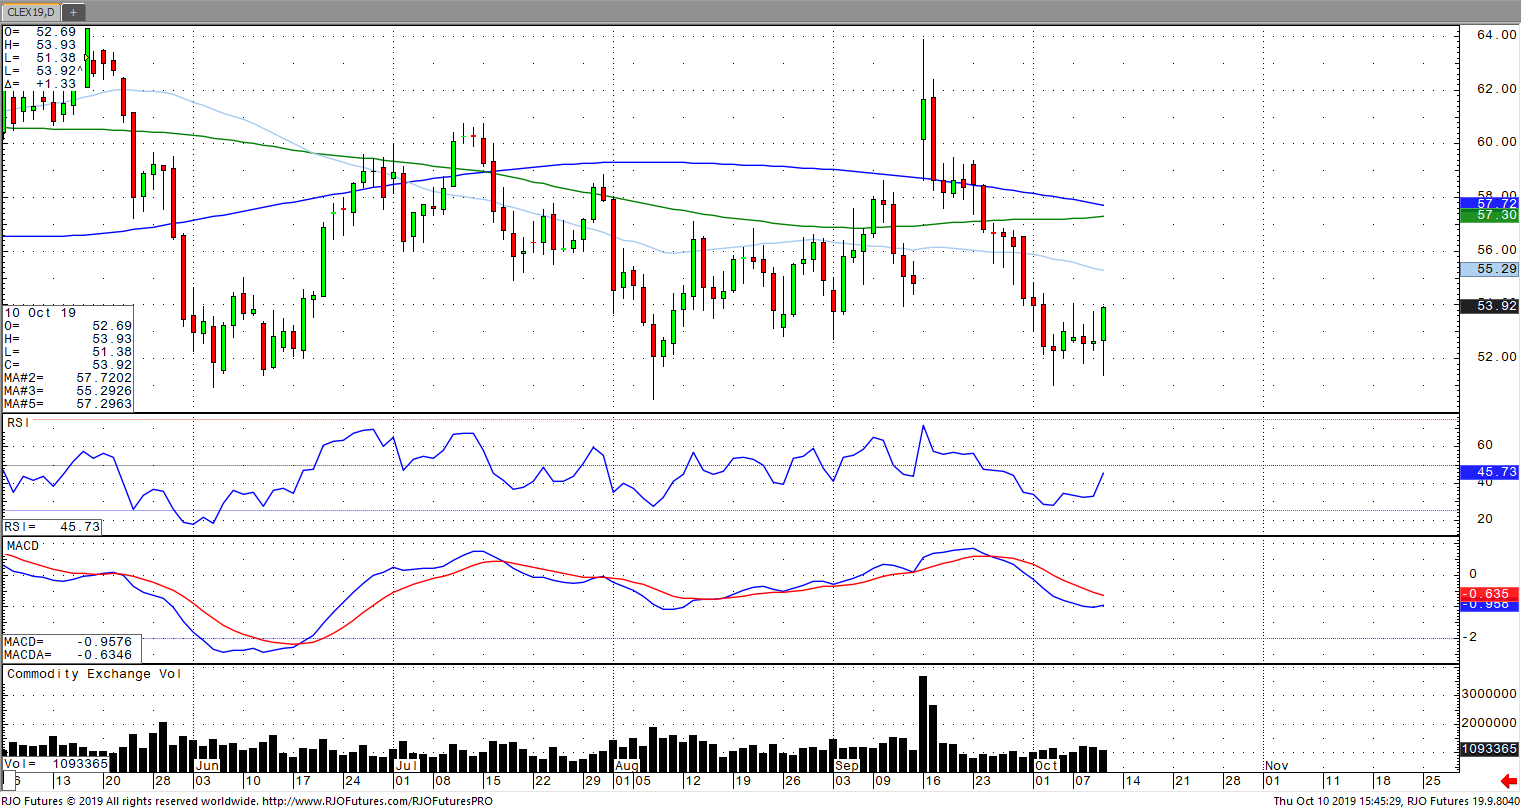
Oil prices have rebounded following Wednesday’s somewhat muted
close after crude had rallied nearly 2%, with data from the EIA showing
inventories rose for the fourth consecutive week and more than expected. In
addition, U.S. supply was shown to have risen to a record 12.6 million barrels
a day. Geopolitical risks remain far from abated with the U.S. withdrawing
troops from Syria, effectively abandoning a strategic ally in the fight against
the Islamic State. On Wednesday, the Turkish military was launching the
offensive in Syria to acquire territory held by the U.S. – backed Kurdish
forces, which the market largely discounted.
Moreover, trade negotiations between the U.S. and China remain ongoing and appeared to have temporarily escalated earlier in the week after the U.S. imposed restrictions on more than two dozen companies and placed visa restrictions on Chinese officials. Any enhanced tensions with China would only serve to heighten demand concerns and further cloud economic growth worries. These demand concerns are coupled with OPEC cutting its forecast for global oil demand to 0.98 million barrels per day for the third consecutive month. As previously noted, geopolitical risk remains the most consequently factor with risk concerns remaining high. The market remains bearish trend with today’s range seen between 51.05 – 55.51.
If you have any questions or would like to discuss the markets further, please feel free to contact me at 800-438-4805 or aturro@rjofutures.com. Softs - Producer Selling Caps Sugar Rally. Chart Looks Heavy.
This week’s comment finds the March sugar contract retracing gains posted in September. Short covering and talk of production deficit for 2019/2020 has provided support to March sugar for weeks. but the last 5 trading sessions have seen this support erode. Failing just under 13.00, at 12.93 to be exact, the March contract has fallen all the way to 12.31. A feature of the recent rally was short covering. The Fund trader was still short about 176k contracts as of October 1. This size short position was a surprise to me. The March contract had rallied above levels where we would normally see the Fund trader getting flat, or even long. We will get another view of this position with Friday’s updated COT, the March contract could be at an inflection point. Again, we see producer selling cap a rally in sugar. If there is more producer selling to be done and the Fund trader gets pushed back into a bearish tilt, we could be headed for a test of the lows. A close below 12.22, forces the fund trader to begin establishing new short positions. The 18-day moving average comes in at 12.47. The longer sugar stays below this level the heavier it is going to look on the chart. March puts give bearish traders short exposure until February 15 of next year.
Softs - Cotton Futures Gain Strength on Supply Concerns
Cotton Futures Gain Strength on Supply Concerns
By: Eric ScolesPosted 10/09/2019
Dec ’19 cotton futures start the morning strong on weak production and optimism on U.S./China Trade talks. After yesterday’s sell-off, cotton prices have sprung back with positive over-night sentiment regarding the upcoming negotiations. While harvest for cotton has been moving forward well ahead of the average pace, production has been limited by poor weather conditions and supplies are starting to tighten. If trade talks can offer positive headlines or a partial deal, this commodity will be very much under-valued. If trade talks end neutral or even negative there could still be a solid opportunity in this market if the USDA Crop Production and Supply/Demand report is bullish. Supply concerns are in place already, with bullish demand news I’d expect an upside break-out from consolidation, and perhaps even sustained bull trend.
On
the heels of mid-Sep-to-early-Oct's steeper, accelerated, 3rd-wave-looking
recovery, the past week-and-a-half's boringly lateral chop is first considered
a corrective/consolidative event that warns of a continuation of the uptrend
that preceded it to new highs above 04-Oct's 891.0 high. This count
remains consistent with our broader base/correction/recovery count introduced
in 13-Sep's Technical Blog following that
day's bullish divergence in short-term momentum above 07-Sep's 809.5 minor
corrective high detailed in the hourly chart below.
The
important takeaway from this month's lateral, sleepy price action is the
definition of Wed's 851.5 low as
the end or lower boundary of a suspected 4th-Wave correction. A failure
below 851.5 will confirm a bearish divergence in daily momentum and defer or
threaten a bullish count enough to warrant non-bullish decisions like
long-covers. A failure below 851.5 will not
necessarily negate a broader bullish count, but it will threaten it enough to
warrant defensive measures as the next pertinent technical levels below 851.5 are
13-Sep's prospective minor 1st-Wave high at 813.8 and obviously 08-Sep's 766.0
low. And making non-bullish decisions "down there" is
sub-optimal to say the least. Per such, both short- and longer-term
commercial traders are advised to pare or neutralize bullish exposure on a
failure below 851.5, acknowledging and accepting whipsaw risk- back above 04-Oct's
891.0 high- in exchange for much deeper and sub-optimal nominal risk below
766.0.
On
a broader scale, the daily log scale chart above shows the developing potential
for a bearish divergence in daily momentum that will be considered confirmed
below 851.5. This chart also shows the past month's recovery thus far
stalling in the immediate neighborhood of the (888.0) Fibonacci
minimum 38.2% retrace of Apr-Sep's entire 1128 - 766 decline). COMBINED
with a failure below 851.5, traders
would then need to be concerned with at least a larger-degree correction pf the
past month's rally and possibly a resumption of Apr-Sep's major downtrend.
Until
and unless the market fails below 851.5 however, we would
remind longer-term players of the key elements on which our bullish count is
predicated:
a confirmed bullish divergence in WEEKLY momentum
(below)
amidst
an
historically low 11% reading in out RJO Bullish Sentiment Index and
a
textbook complete and major 5-wave Elliott sequence down from 29-Apr's
1128 high to 08-Sep's 766.0 low.
Thus
far, the market is only a month into correcting a 4-MONTH, 32% drawdown, so
further and possibly protracted gains remain well within the bounds of a major
(suspected 2nd-Wave) correction of Apr-Sep's decline within an even more
massive PEAK/reversal process from 17-May's 1219 high on an active continuation
basis below.
These
issues considered, a bullish policy and exposure remain advised with a failure
below 851.5 required to defer or threaten this call enough to warrant moving to
a neutral/sideline position. In lieu of such weakness, we anticipate a
continuation of the past month's rally to new highs and potentially significant
gains above 891.0.
Agricultural - Grain Futures Update w/Stephen Davis - 10/11/2019
Grain Futures Update w/Stephen Davis - 10/11/2019
By: Stephen DavisPosted 10/11/2019
Stephen Davis discusses the weeks movement in the grain market. Stephen does a deep dive on the corn market after a tumultuous week and gives insight into what he expects.Agricultural - Cattle Market Overbought
Cattle Market Overbought
By: Peter McGinnPosted 10/09/2019
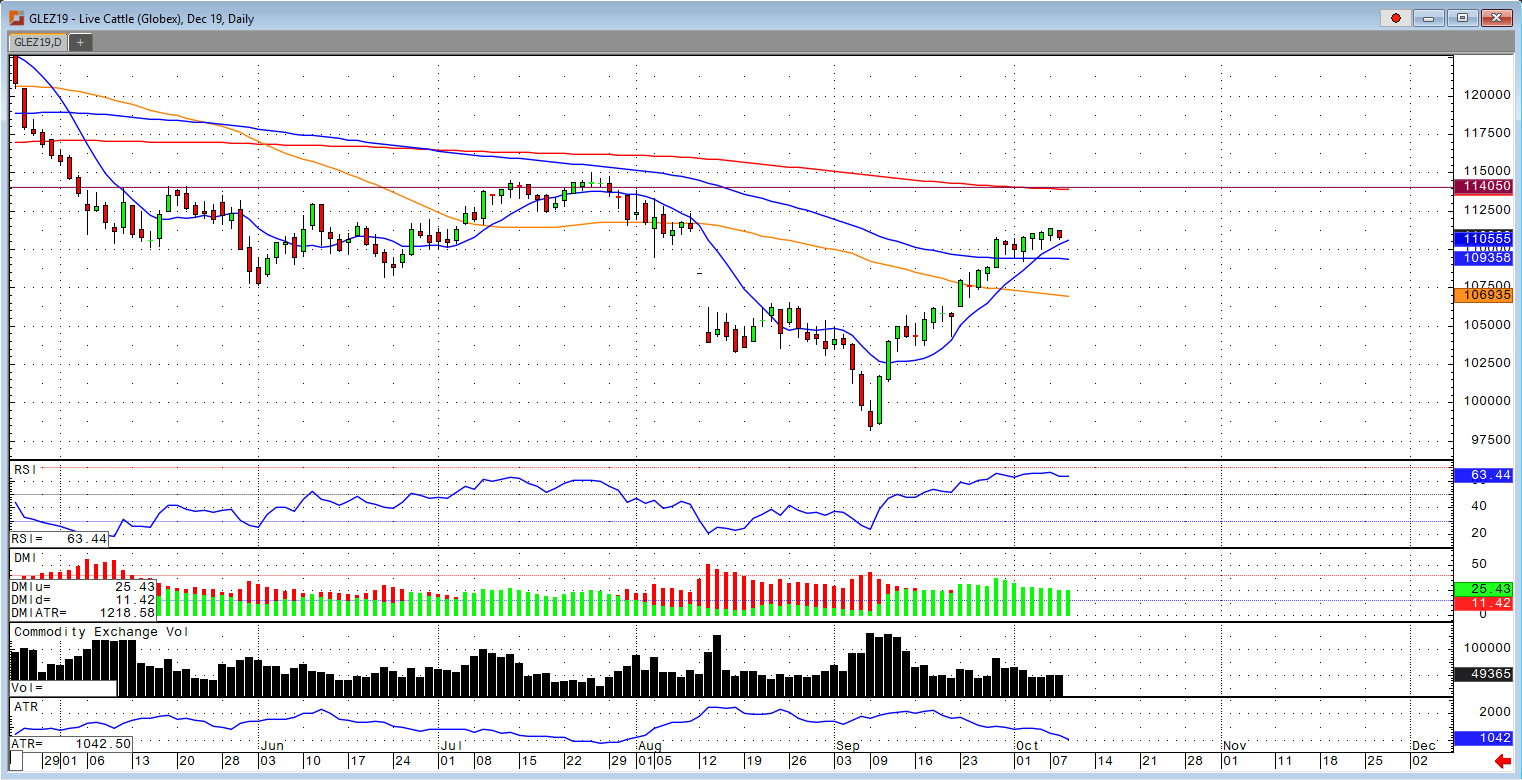
In the December cattle contract, we have seen some
consolidation over the past seven trading sessions which is most likely the
market attempting to correct its overbought condition. The cash market has not
traded yet this week, but the market is holding firm with the $107 cash trade
from the week before. If there is any bearish news that comes out, then we
could see selling in the market because of the overbought condition as
previously mentioned. When you look at the CoT from Oct.1st showed
that the managed money when from a NET short position to a NET long position.
One of the major fundamental factors that will be coming to the market is the
forecast for snow in the northern plains for the weekend and this harsh weather
could be seen as a supportive factor in the markets. USDA boxed beef cutout
values were up $1.99 at mid-session yesterday and closed $2.51 higher at
$213.60. This was up from $213.47 the prior week. There is no trade in the cash
market so far this week. Cash cattle traded in Kansas on Friday at $107, up
from $103 to $104.50 the previous week and $101.60 two weeks ago. In Texas,
they traded at $107 (3,198 head) on Friday from $106 Thursday (2,872 head)
which was up from $103-$104 the previous week and $101 two weeks ago. The USDA
estimated cattle slaughter came in at 117,000 head yesterday. This brings the
total for the week so far to 233,000 head, down from 234,000 last week at this
time and down from 234,000 a year ago.
The trend in the market is still up but we need to see if there any cash trades take place this week to give more support to the market. A break overt the $111.50 level would lead me to believe that we see a continuation to the July highs of $115.00 or at least around the 200-day moving average of $114.00.
Currency - The USD Moves Lower as the Fed Initiates “Not QE”
The USD Moves Lower as the Fed Initiates “Not QE”
By: Ian BannonPosted 10/11/2019
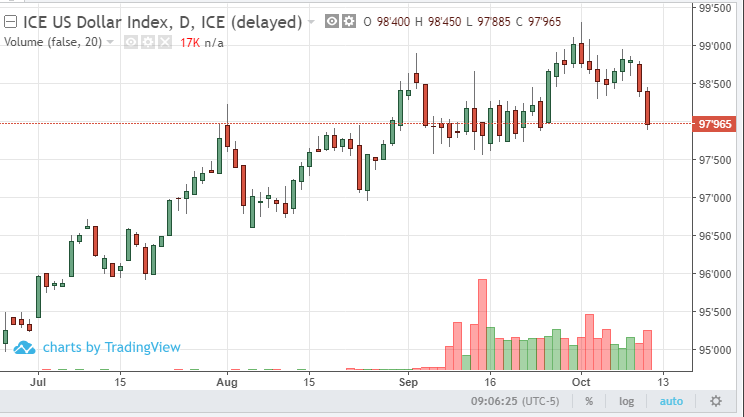
U.S. dollar futures are 40 points lower Friday morning,
while foreign currencies gain upside momentum as the market reacts to Chairman
Powell’s comments regarding treasury buybacks. Given the liquidity squeeze in
the money supply, and the relentless strength in the U.S. dollar this year, it
was only a matter of time before the Fed was forced to unravel, what is
essentially, another round of quantitative easing. The chairman announced
Wednesday that America’s central bank would buy back approximately $20 billion
monthly in treasury debt, injecting much needed liquidity into the U.S. economy
and breaking the dollar down off its highs, at least temporarily. This should
adjust the huge disconnect between the greenback and the currencies of other
developed economies. In particular, the British pound is showing strength this
week. Investors are hopeful that an end to the ongoing Brexit situation is
imminent.
Technically speaking, the pound has been depressed over the last few months and has finally carved out a base. The euro is catching a bid despite severely depressed manufacturing data out of that economic zone. This is likely a “win-by-default” scenario, as the dollar takes a breather after its strong run. Safe-haven currencies are selling off, as the Chinese trades talks are apparently “going very well”. The leaders are in Washington again on Friday, and any signs of tension could initiate reversal moves quickly. Investors are not expecting a complete deal but are looking for some concessions and perhaps an interim deal to satisfy markets in the short-term. While the currency sector appears to be reversing trend, I believe the dollar will fight to hold within the September range during Q4 before moving higher next year.
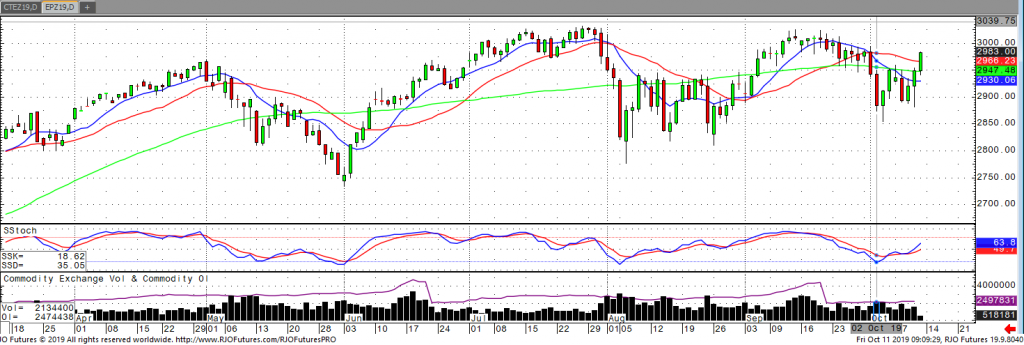
The S&P continued its push higher this morning on positive outlooks on the U.S./China trade talks from yesterday and today. The market looks to finish the week higher after declining on Tuesday and pushing to a low of 2881.75 on Thursday when reports of Chinese headlines stating that trade negotiations weren’t seeing progress. Once the U.S. markets opened and we saw that talks were still on schedule, the market reversed and closed positive on the day. It seems that the attack on an Iranian oil tanker hasn’t done much to hinder the move higher this morning on the S&P. The market looks to remain bullish in the short term as any headlines we see this afternoon will have a positive spin. The next upside target is resistance at 2970 and 2995 with support coming in at 2935. A close under support would propel a move lower to 2890.
If you have any questions or would like to discuss the markets further, please feel free to contact me at 800-826-2270 or therrmann@rjofutures.com. Economy - S-T Mo Failure Insufficient to End RBOB Correction, But Beware
S-T Mo Failure Insufficient to End RBOB Correction, But Beware
By: RJO Market InsightsPosted 11/08/2022
Posted on Nov 08, 2022, 07:51 by Dave Toth
In Fri's Technical Webcast we identified a
minor corrective low at 2.6328 from Thur as a mini risk parameter the market
needed to sustain gains above to maintain a more immediate bullish count.
The 240-min chart below shows the market's failure overnight below this level,
confirming a bearish divergence in very short-term momentum. This mo
failure defines Fri's 2.8172 high as
one of developing importance and a parameter from which very short-term traders
can objectively base non-bullish decisions like long-covers.
Given
the magnitude of the past three weeks' broader recovery however, this
short-term momentum failure is of an insufficient scale to conclude anything
more than another correction within this broader recovery from 26-Sep's 2.1877
low. Indeed, overnights failure below 2.6328 only allows us to conclude
the end of the portion of the month-and-a-half rally from 31-Oct's 2.4822 next
larger-degree corrective low. 2.4822 is the
risk parameter this market still needs to fail below to break the uptrend from
18-Oct's 2.3526 low while this 2.3526 low
remains intact as the risk parameter this market needs to fail below to break
the month-and-a-half uptrend. From an
intermediate-to-longer-term perspective, this week's setback falls well within
the bounds of another correction ahead of further gains. This is another
excellent example of the importance of technical and trading SCALE and
understanding and matching directional risk exposure to one's personal risk
profile.
The
reason overnight's admittedly minor mo failure might have longer-term
importance is the 2.8172-area from which it stemmed. In
Fri's Technical Blog we also noted the market's engagement of the
2.8076-to-2.8159-area marked by the 61.8% retrace of Jun0-Sewp's 3.2758 -2.1877
decline and the 1.000 progression of Sep-Oct's initial 2.1877 - 2.6185
(suspected a-Wave) rally from 18-Oct's 2.3526 (suspected b-Wave) low. We
remind longer-term players that because of the unique and compelling confluence
of:
early-Aug's bearish divergence in WEEKLY momentum
amidst
historically
extreme bullish sentiment/contrary opinion levels in our RJO Bullish
Sentiment Index
an
arguably complete and massive 5-wave Elliott sequence from Mar'20's 0.4605
low to Jun's 4.3260 high (as labeled in the weekly log active-continuation
chart below) and
the
5-wave impulsive sub-division of Jun-Sep's (suspected initial 1st-Wave) decline
The
recovery attempt from 26-Sep's 2.1877 low is arguably only a 3-wave (Wave-2)
corrective rebuttal to Jun-Sep's decline within a massive, multi-quarter
PEAK/reversal process. Now granted, due to the magnitude of 2020 -2022's
secular bull market, we discussed the prospect for this (2nd-Wave corrective)
recovery to be "extensive" in terms of both price and time. A
"more extensive" correction is typified by a retracement of 61.8% or
more and spanning weeks or even months following a 3-month decline. Per
such, the (suspected corrective) recovery from 26-Sep's 2.1877 low could easily
have further to go, with commensurately larger-degree weakness than that
exhibited this week (i.e., a failure below at least 2.4822) required
to consider the correction complete. Indeed, the daily log chart above
shows the market thus far respecting former 2.6185-area resistance from 10-Oct
as a new support candidate.
These
issues considered, very shorter-term traders have been advised to move to a neutral/sideline
position following overnight's momentum failure below 2.6328, with a recovery
above 2.8172 required to negate this call, reaffirm the recovery and re-expose
potentially significant gains thereafter. For intermediate- and
longer-term players, a bullish policy and exposure remain advised with a
failure below 2.4822 required to threaten this call enough to warrant
neutralizing exposure. We will be watchful for another bearish divergence
in momentum following a recovery attempt that falls short of Fri's 2.8172 high
that would be considered the next reinforcing factor to a count calling that
2.8172 high the prospective end to the month-and-a-half 2nd-Wave
correction. In lieu of such, a resumption of the current rally to
eventual new highs above 2.8172 should not surprise.