Attention New or Frustrated Traders:
Do you want to get into futures trading, but don’t have the time or knowledge necessary to do so? If yes, then RJO Echo Trading is for you. RJO Echo Trading is an intuitive way for investors or “echo followers” to automatically match the performance of veteran and accomplished traders. As an “Echo Follower” you will choose from a selection of proven, vetted, and experienced “Echo Leaders”, all you have to do is a pay a subscription fee and your account will mimic the trades of your chosen “Leader”. Echo Trading eliminates the learning curve needed to trade futures, making it an option for all.
The Markets
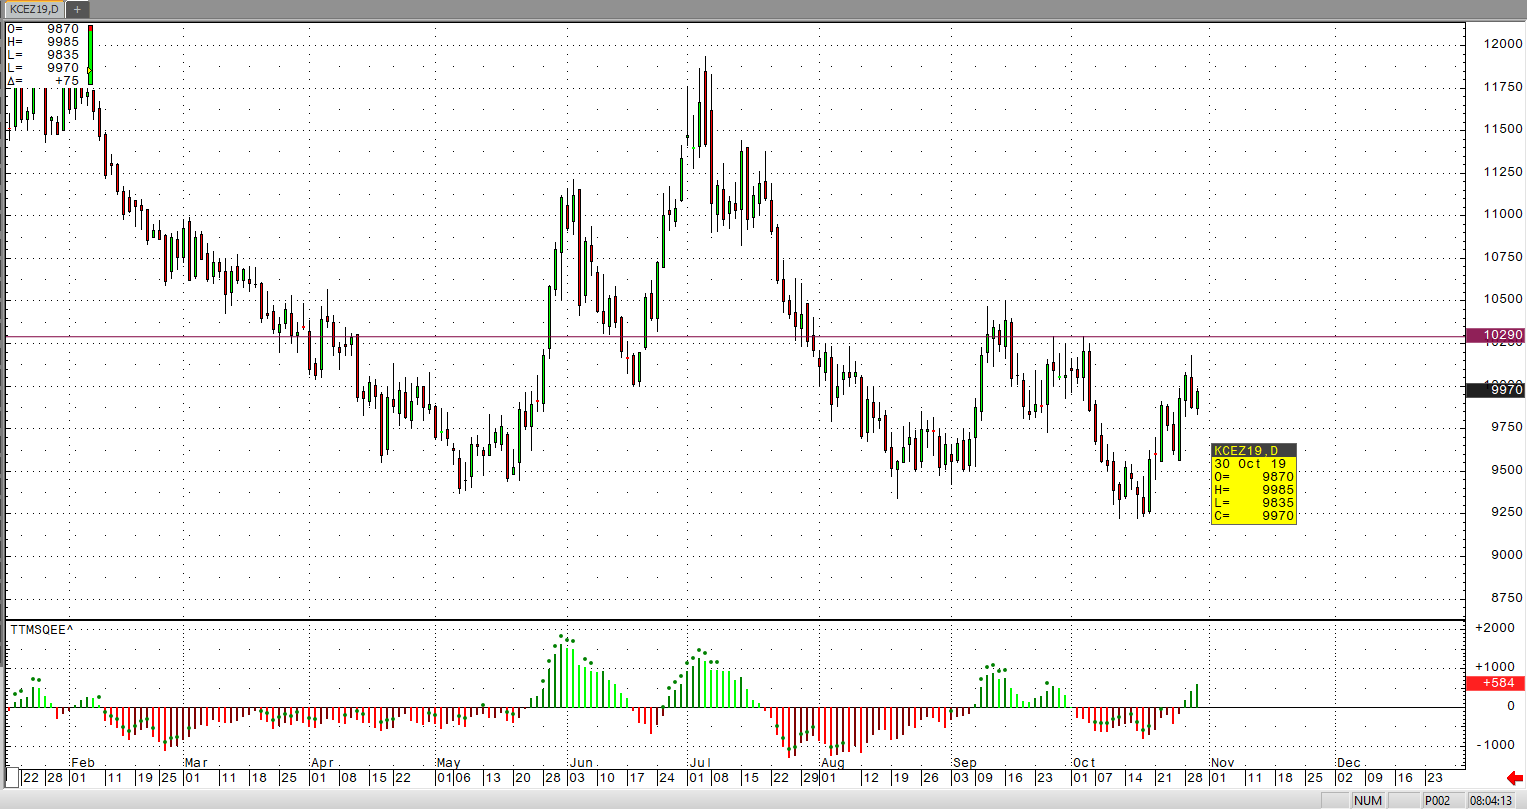
Metals - Will Todays Job Number Keep Gold Above $1,500?
Will Todays Job Number Keep Gold Above $1,500?
By: Nicholas DeGeorgePosted 11/01/2019
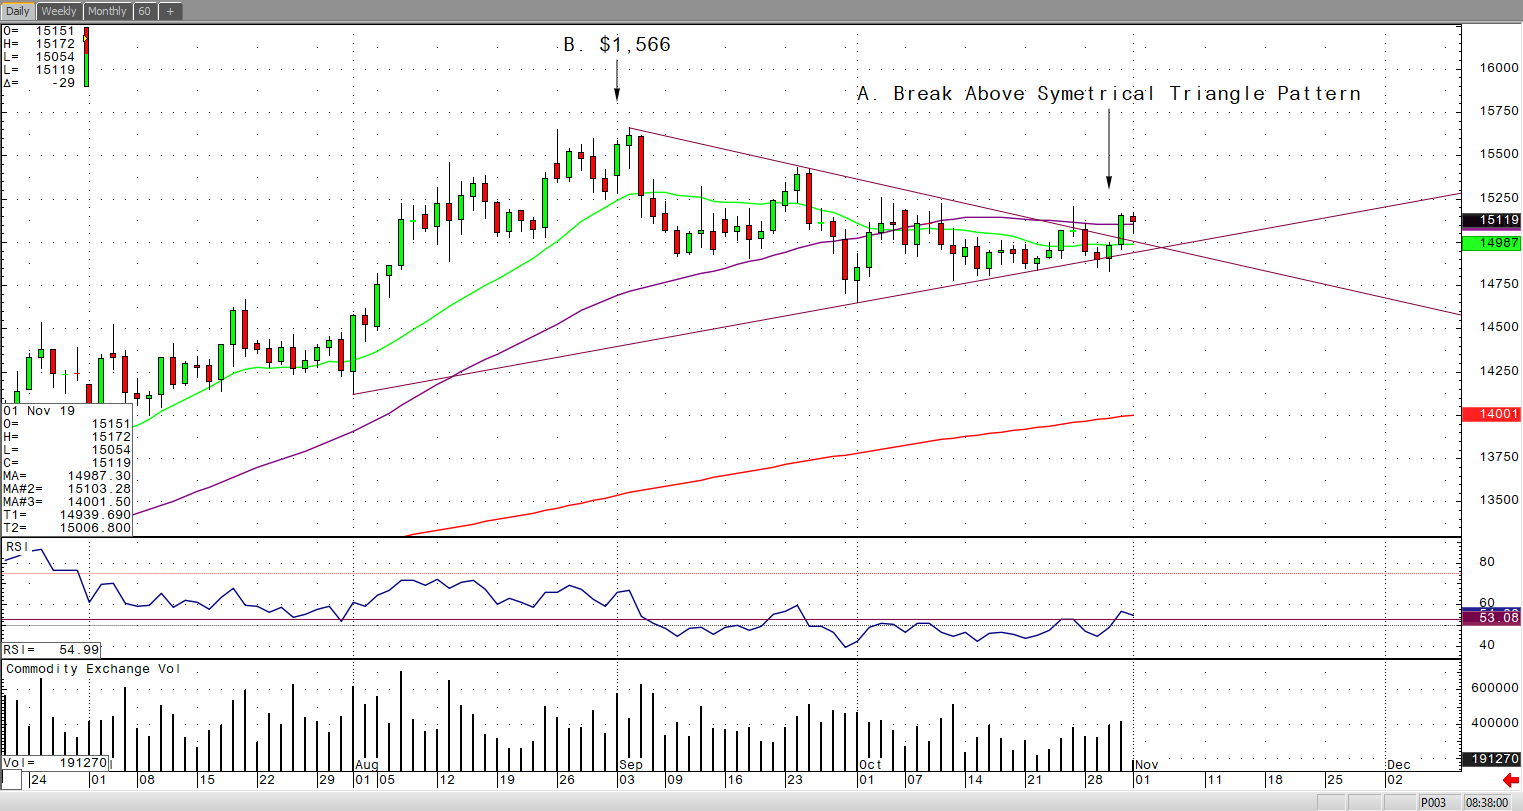
In the early morning trade, gold has pulled back slightly off its overnight highs because of a blowout jobs number of 128K after expectations of only 85K. Furthermore, African-American unemployment has hit another record low of 5.4% along with a three-month average of 176K jobs added to the U.S.-this is great news that we should ALL be celebrating! Remember, we hit these blowout numbers even though the GM strike of 303,000 people was going on and an ongoing trade war with China. The numbers don’t lie-America Rocks! December gold has pulled back slightly off today’s news but remains technically strong and with the announcement yesterday that the Democrats are proceeding with the impeachment of our President. Again, even though we had a great jobs number this morning, I think with the ongoing trade war with China and this impeachment that the bulls might keep gold above $1,500 an ounce.
If we look at December gold, you’ll clearly see that yesterday it broke out of the symmetrical triangle pattern and is trading above all its major moving averages, which should be a very bullish sign for the shiny one. Furthermore, it leaves gold open now to trade back to contracts highs of $1,566 an ounce made back in early September. I highlighted these levels below on my RJO Futures Pro daily December gold chart.
The silver market has been stuck in a sideways range for the month of October and we saw that continue this week with December silver starting this week with a move lower before concerns of global economic slowing helped the market recover from Wednesday’s 17.59 low. Reports from China that a long-term trade agreement with the U.S. is unlikely lends support to the silver market and counter acted the Fed’s rate-cut, but Friday’s nonfarm payrolls and unemployment numbers added pressure. Weakness in the U.S. dollar and calls for a coming global recession give the bulls hope but until we see continued economic data to support those views, silver looks to continue in this sideways range. A close over resistance at 18.225 is needed to continue the move higher to 18.80 while a break of 17.60 would most likely push the market down to support at 17.30 or 17.00.
If you have any questions or would like to discuss the markets further, please feel free to contact me at 800-826-2270 or therrmann@rjofutures.com. Energy - Oil Prices Continue Slide
Oil Prices Continue Slide
By: Alexander Turro, Senior Market StrategistPosted Nov 1, 2019 7:34AM CT
Oil prices have fallen for the fourth consecutive session amid a 5.7-million barrel increase in EIA crude stocks as well as soft global economic data with Chinese manufacturing activity falling to an eight month low and Chicago PMIs falling into contraction territory and the lowest on record since December 2015. Adding to the bearish sentiment were renewed concerns over the ongoing U.S.-China trade war with Chinese officials reportedly skeptical of a longer-term deal. In addition, record U.S. production has weighed on prices. Despite the recent pullback, Dec crude remains about 4.00 above the October low with geopolitical risk an ongoing threat. The market is bullish trend with today’s range seen between 53.09 – 57.38.
If you have any questions or would like to discuss the markets further, please feel free to contact me at 800-438-4805 or aturro@rjofutures.com. Softs - Weather Premium and Global Risk Sentiment Leading Cocoa Futures
Weather Premium and Global Risk Sentiment Leading Cocoa Futures
By: Peter MoosesPosted 11/01/2019
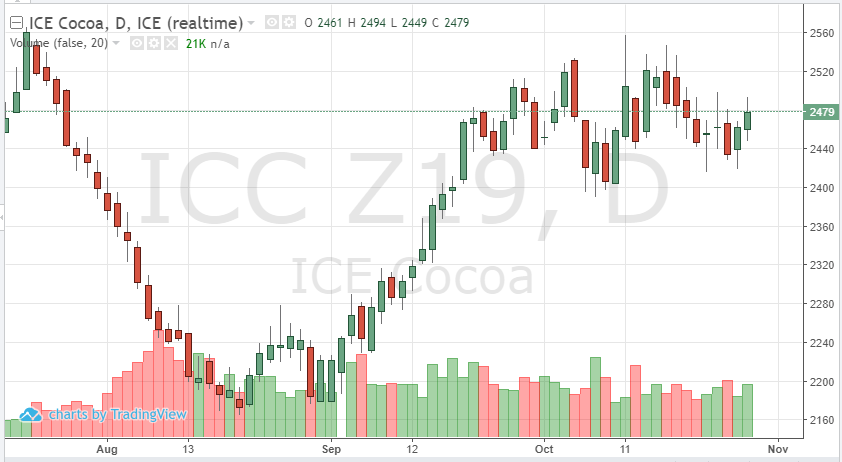
Current weather conditions are supporting cocoa prices. Rain
in key growing regions could cause supply issues. The ongoing concern with
global demand is also causing prices to consolidate and trade in a range. 2495
has held as resistance.
Global risk sentiment has added to volatility in currencies,
which has carried over to cocoa prices - the Pound and Euro are the two main
contributors.
If dry weather returns in West Africa after this recent rain, new crop cocoa beans could have some disease and damage, this could propel futures’ prices over 3000. This will be critical as traders begin to roll from the December to March contract over the next few weeks.
Softs - Coffee Holding Support
Coffee Holding Support
By: Adam TuiaanaPosted 10/30/2019
The price action in December coffee has been quite
supportive, with higher highs and lows consistently. Many fundamentals, such as
a strong Brazilian currency and weaker U.S. dollar have lent some strong
support to December coffee prices, as well as several other commodities. At this point, many traders have eyes on
weather issues that may be forming in key growing areas of Brazil, coupled with
the expectation that the second largest producing country, Vietnam, will fall
short of its projected exports. Our friends at The Hightower Group have reported
that “Vietnam coffee exports are expected
to come in at 1.365 million tonnes (22.75 million bags) which is 13.8% behind
last year’s pace. ICE exchange coffee stocks rose by 180 bags on Tuesday but
with 2 days to go remain nearly 38,000 below September’s month-end total.”
On the technical side, a battle awaits at the 103-resistance level in the near term, and after a noticeably impressive rally, a correction is likely at this point. Momentum levels are strong, but until we get a good feel for how bad the upcoming weather conditions in Brazil will be, we are likely to see December coffee prices remain in a sideways consolidation pattern.
On
the heels of mid-Sep-to-early-Oct's steeper, accelerated, 3rd-wave-looking
recovery, the past week-and-a-half's boringly lateral chop is first considered
a corrective/consolidative event that warns of a continuation of the uptrend
that preceded it to new highs above 04-Oct's 891.0 high. This count
remains consistent with our broader base/correction/recovery count introduced
in 13-Sep's Technical Blog following that
day's bullish divergence in short-term momentum above 07-Sep's 809.5 minor
corrective high detailed in the hourly chart below.
The
important takeaway from this month's lateral, sleepy price action is the
definition of Wed's 851.5 low as
the end or lower boundary of a suspected 4th-Wave correction. A failure
below 851.5 will confirm a bearish divergence in daily momentum and defer or
threaten a bullish count enough to warrant non-bullish decisions like
long-covers. A failure below 851.5 will not
necessarily negate a broader bullish count, but it will threaten it enough to
warrant defensive measures as the next pertinent technical levels below 851.5 are
13-Sep's prospective minor 1st-Wave high at 813.8 and obviously 08-Sep's 766.0
low. And making non-bullish decisions "down there" is
sub-optimal to say the least. Per such, both short- and longer-term
commercial traders are advised to pare or neutralize bullish exposure on a
failure below 851.5, acknowledging and accepting whipsaw risk- back above 04-Oct's
891.0 high- in exchange for much deeper and sub-optimal nominal risk below
766.0.
On
a broader scale, the daily log scale chart above shows the developing potential
for a bearish divergence in daily momentum that will be considered confirmed
below 851.5. This chart also shows the past month's recovery thus far
stalling in the immediate neighborhood of the (888.0) Fibonacci
minimum 38.2% retrace of Apr-Sep's entire 1128 - 766 decline). COMBINED
with a failure below 851.5, traders
would then need to be concerned with at least a larger-degree correction pf the
past month's rally and possibly a resumption of Apr-Sep's major downtrend.
Until
and unless the market fails below 851.5 however, we would
remind longer-term players of the key elements on which our bullish count is
predicated:
a confirmed bullish divergence in WEEKLY momentum
(below)
amidst
an
historically low 11% reading in out RJO Bullish Sentiment Index and
a
textbook complete and major 5-wave Elliott sequence down from 29-Apr's
1128 high to 08-Sep's 766.0 low.
Thus
far, the market is only a month into correcting a 4-MONTH, 32% drawdown, so
further and possibly protracted gains remain well within the bounds of a major
(suspected 2nd-Wave) correction of Apr-Sep's decline within an even more
massive PEAK/reversal process from 17-May's 1219 high on an active continuation
basis below.
These
issues considered, a bullish policy and exposure remain advised with a failure
below 851.5 required to defer or threaten this call enough to warrant moving to
a neutral/sideline position. In lieu of such weakness, we anticipate a
continuation of the past month's rally to new highs and potentially significant
gains above 891.0.
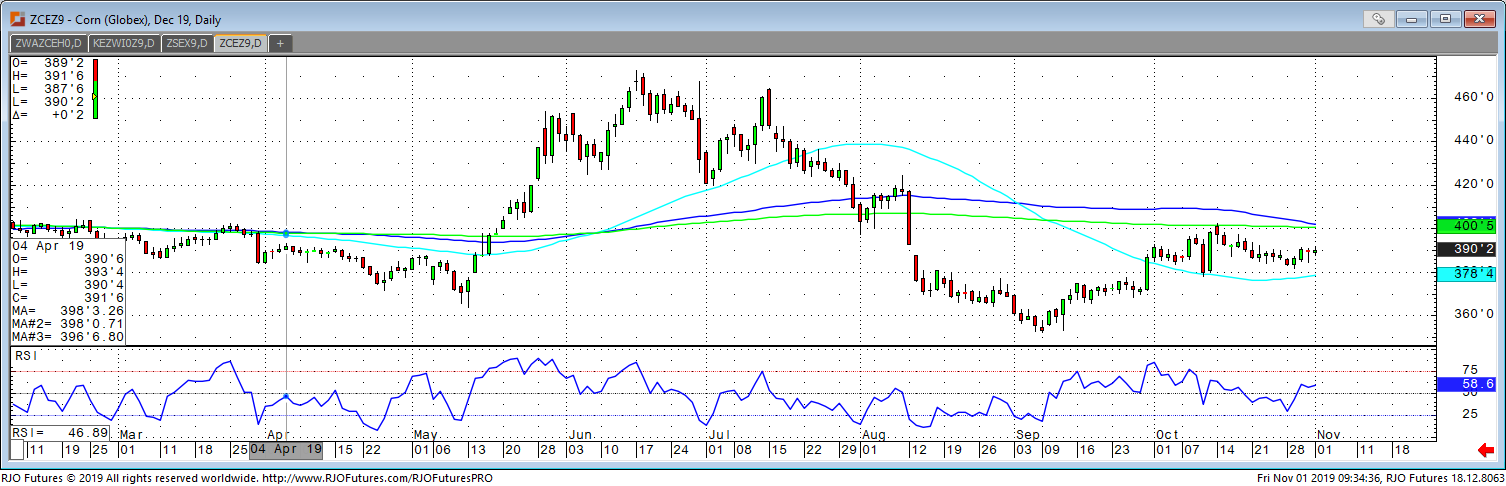
Agricultural - Harvest Weather Looks to be Improving for Corn, Focus Shifts to Nov USDA
Harvest Weather Looks to be Improving for Corn, Focus Shifts to Nov USDA
By: Tony Cholly, Senior Market StrategistPosted Nov 1, 2019 9:43AM CT
For three trading sessions in a row now, the corn market has
closed up, near the daily highs. As focus shifts to November 8th
crop production update, the market may be supported today and into next week.
Weekly exports were disappointing again, which was what caused early weakness
yesterday. Export sales came in at 549,100 tonnes. Pre-report estimates were 350,000 to 750,000
tonnes. As of October 24th, cumulative sales were only 23% of the
USDA forecast for 2019/2020, vs. a 5-year average of 36%. The market would need
to see sales of 824,000 tonnes are needed each week to reach the USDA forecast.
The recent snow and cold through the Midwest has slowed harvest, but a shift to
drier weather the first 10 days of November should get things back on track.
December corn ended the month of October up 2 cents, with a 24.25 cent range. Resistance comes in at 392 and 395 with support coming in at 386 and 382.
If you have any questions or would like to discuss the markets further, please feel free to contact me at 800-826-2270 or tcholly@rjofutures.com. Agricultural - Grain Futures Update w/Stephen Davis - 11/01/2019
Grain Futures Update w/Stephen Davis - 11/01/2019
By: Stephen DavisPosted 11/01/2019
RJO Futures Senior Market Strategist discusses how the changing weather and early winter could affect the grain markets. Most of the mid-west was hit with snow this week and Stephen predicts this could lead to a bearish report next Friday.Currency - Friday's Jobs Number Holds All The Cards for the USD
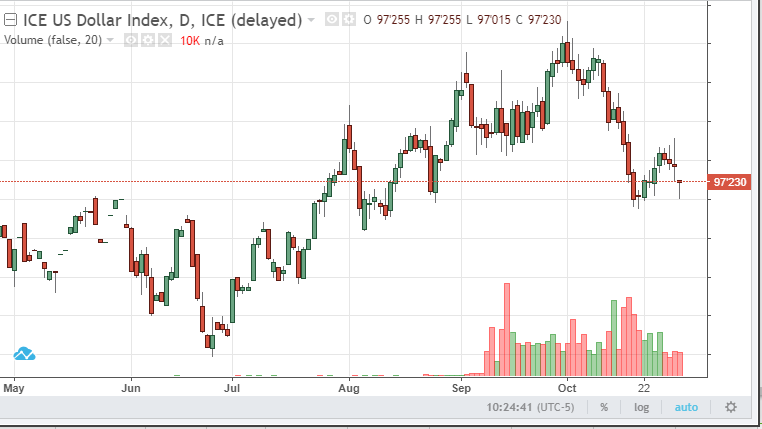
Friday's Jobs Number Holds All The Cards for the USD
By: Ian BannonPosted 10/31/2019
U.S.
dollar futures gapped lower off the open on Thursday due to deteriorating trade
headlines and the potential for disappointing U.S. jobs data Friday morning.
September nonfarm payrolls are expected to increase by 90,000 jobs, compared to
136,000 in August. Furthermore, the Federal Reserve cut the fed funds rate
another 25 bps on Wednesday, strengthening downside pressure on the greenback.
Although the FOMC decided to cut another quarter point, they hinted at a
potential pause in the rate cut cycle. The odds of a December cut are at 28%
Thursday morning. The ambiguous attitude of the Fed can be credited to the
strength of the labor market and the resilience of the American consumer. Being
that consumer spending makes up 70% of GDP, the U.S. economy is unlikely to
enter recession so long as the labor market remains strong and consumers
continue to spend. This is the reason all eyes will be on Friday’s jobs number.
Any weakness is likely to break the dollar down further, while a surprise beat
is expected to hold Dec futures at the pivotal 97 support level. A close under
97 will antagonize sellers.
Meanwhile, foreign currency futures are moving to the upside this week, with leadership from the Australian dollar. European currencies are performing well but have been held back by another Brexit delay. Should the dollar break under the 97-support zone, investors should be bullish on all foreign currencies. Should there be further deterioration in trade talks, or a continued breakdown in economic data, the safe-haven currencies are likely to show leadership (i.e. the yen and the Swiss franc). The resilience of the U.S. dollar has kept other currencies suppressed. As the dollar weakens, a plethora of opportunities will be created as currency markets reverse trend. If you have any questions about how to get started trading currency futures, don’t hesitate to contact me directly.
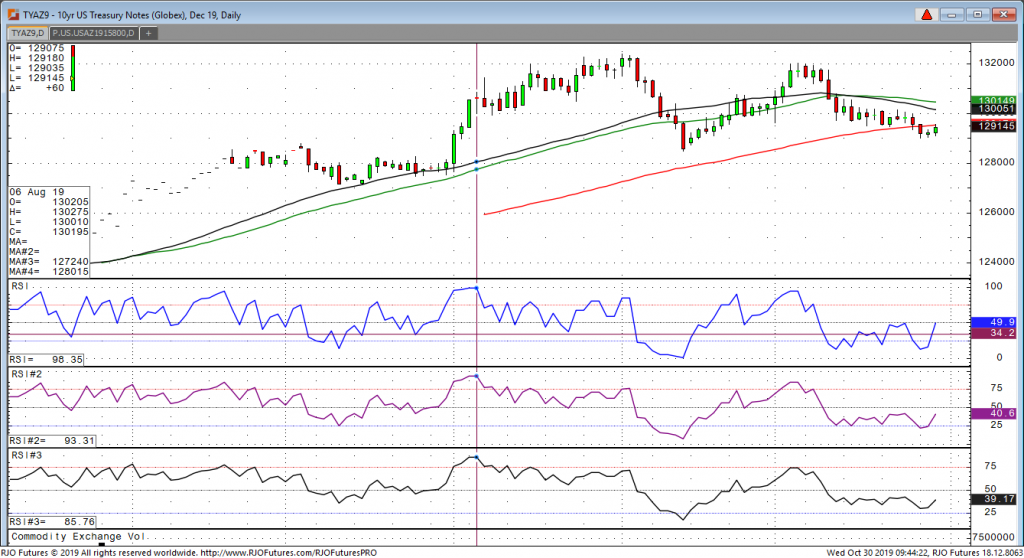
Interest Rates - Fed Expected to Cut Interest Rates by .25%
Today is a big day for both the treasury and stock markets
as the Fed is widely expected to cut rates by ¼ point. The announcement comes
at 1:00pm central with Powell’s press conference at 1:30pm. Noteworthy news
already out today is the GDP number, which came out at 1.9% while the street
was looking for 1.6%, so it was a beat. However, the GDP was still below 2% so
the news wasn’t all that bad although it beat the lowball number at 1.6%. In
addition to the GDP report, we also saw ADP which came out near expectations
around 125k.
About 30 minutes ago, the Chilean President Pinera announced that he was cancelling the APEC summit schedule in Santiago next month. This is important because that is where the U.S. and China had planned to sign “Phase 1” of the trade deal. Going back to today’s major news, the market has already priced in the expected .25% cut today which should be no surprise, but what is of major importance is what Powell says in his press conference. Traders will key on any change in language and will pay extra attention whether he comes out as hawkish or dovish and the trade will dictate as such. On Friday we see monthly payrolls. The street is expecting 85k vs last month 136K gain.
If you have any questions or would like to discuss the markets further, please feel free to contact me at 800-826-2270 or gperlin@rjofutures.com. Equity - Strong Jobs Data Move Equities to All-Time Highs
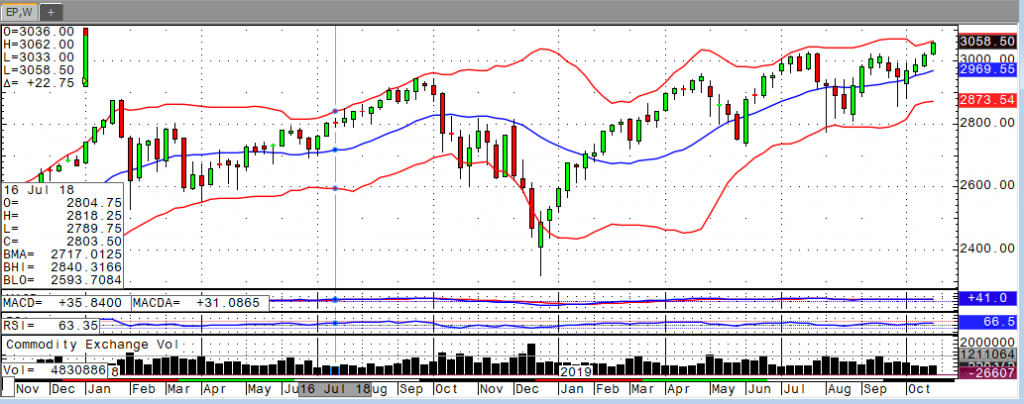
Strong Jobs Data Move Equities to All-Time Highs
By: Ian BannonPosted 11/01/2019
U.S. equity futures are unanimously in the green Friday morning after the release of upbeat jobs data. Nonfarm payrolls were expected to increase by 90,000 in September, but the actual number came in at 128,000. The labor market remains strong, with average hourly earnings growing by 3% year-over-year, right in line with expectations. The wage growth component will be a key factor moving forward. When the economy moves into the late stages of the business cycle, we see wage growth accelerate. This is the result of a saturated labor market, and it tells investors the economy is operating at full employment. From there, nonfarm payrolls can be expected to slow down. We are not there yet. Chairman Powell acknowledged the strong labor market when he hinted at a pause in the rate cut cycle during Wednesday’s Fed announcement. Essentially, the strong labor market is helping to prop up the American consumer, which is helping to prop up the broader economy. And these labor numbers indicate that we have not yet reached a tipping point. Technically speaking, the e-mini S&P chart could not have a more bullish configuration. Each dip over the last 6 months has been proceeded by higher lows, and stocks are now breaking out of a one-year consolidation period. In short, the bull has not yet run out of steam, and a close over 3055 hints that another leg higher is in short order.
Economy - S-T Mo Failure Insufficient to End RBOB Correction, But Beware
S-T Mo Failure Insufficient to End RBOB Correction, But Beware
By: RJO Market InsightsPosted 11/08/2022
Posted on Nov 08, 2022, 07:51 by Dave Toth
In Fri's Technical Webcast we identified a
minor corrective low at 2.6328 from Thur as a mini risk parameter the market
needed to sustain gains above to maintain a more immediate bullish count.
The 240-min chart below shows the market's failure overnight below this level,
confirming a bearish divergence in very short-term momentum. This mo
failure defines Fri's 2.8172 high as
one of developing importance and a parameter from which very short-term traders
can objectively base non-bullish decisions like long-covers.
Given
the magnitude of the past three weeks' broader recovery however, this
short-term momentum failure is of an insufficient scale to conclude anything
more than another correction within this broader recovery from 26-Sep's 2.1877
low. Indeed, overnights failure below 2.6328 only allows us to conclude
the end of the portion of the month-and-a-half rally from 31-Oct's 2.4822 next
larger-degree corrective low. 2.4822 is the
risk parameter this market still needs to fail below to break the uptrend from
18-Oct's 2.3526 low while this 2.3526 low
remains intact as the risk parameter this market needs to fail below to break
the month-and-a-half uptrend. From an
intermediate-to-longer-term perspective, this week's setback falls well within
the bounds of another correction ahead of further gains. This is another
excellent example of the importance of technical and trading SCALE and
understanding and matching directional risk exposure to one's personal risk
profile.
The
reason overnight's admittedly minor mo failure might have longer-term
importance is the 2.8172-area from which it stemmed. In
Fri's Technical Blog we also noted the market's engagement of the
2.8076-to-2.8159-area marked by the 61.8% retrace of Jun0-Sewp's 3.2758 -2.1877
decline and the 1.000 progression of Sep-Oct's initial 2.1877 - 2.6185
(suspected a-Wave) rally from 18-Oct's 2.3526 (suspected b-Wave) low. We
remind longer-term players that because of the unique and compelling confluence
of:
early-Aug's bearish divergence in WEEKLY momentum
amidst
historically
extreme bullish sentiment/contrary opinion levels in our RJO Bullish
Sentiment Index
an
arguably complete and massive 5-wave Elliott sequence from Mar'20's 0.4605
low to Jun's 4.3260 high (as labeled in the weekly log active-continuation
chart below) and
the
5-wave impulsive sub-division of Jun-Sep's (suspected initial 1st-Wave) decline
The
recovery attempt from 26-Sep's 2.1877 low is arguably only a 3-wave (Wave-2)
corrective rebuttal to Jun-Sep's decline within a massive, multi-quarter
PEAK/reversal process. Now granted, due to the magnitude of 2020 -2022's
secular bull market, we discussed the prospect for this (2nd-Wave corrective)
recovery to be "extensive" in terms of both price and time. A
"more extensive" correction is typified by a retracement of 61.8% or
more and spanning weeks or even months following a 3-month decline. Per
such, the (suspected corrective) recovery from 26-Sep's 2.1877 low could easily
have further to go, with commensurately larger-degree weakness than that
exhibited this week (i.e., a failure below at least 2.4822) required
to consider the correction complete. Indeed, the daily log chart above
shows the market thus far respecting former 2.6185-area resistance from 10-Oct
as a new support candidate.
These
issues considered, very shorter-term traders have been advised to move to a neutral/sideline
position following overnight's momentum failure below 2.6328, with a recovery
above 2.8172 required to negate this call, reaffirm the recovery and re-expose
potentially significant gains thereafter. For intermediate- and
longer-term players, a bullish policy and exposure remain advised with a
failure below 2.4822 required to threaten this call enough to warrant
neutralizing exposure. We will be watchful for another bearish divergence
in momentum following a recovery attempt that falls short of Fri's 2.8172 high
that would be considered the next reinforcing factor to a count calling that
2.8172 high the prospective end to the month-and-a-half 2nd-Wave
correction. In lieu of such, a resumption of the current rally to
eventual new highs above 2.8172 should not surprise.