Orion Multi-Trader is a high-performance, multi-asset, broker-neutral platform for sophisticated investors. A powerful analysis and trading tools that enables you to design, execute and manage automated order strategies with ease.
Easy order management directly from Charts, Price Ladder or Quotes
Technical indicators with Orion MT’s advanced charts
Design, execute and manage automated order strategies with ease
Simulated trading environment
…..
RJO Echo Trading!
Attention New or Frustrated Traders:
Do you want to get into futures trading, but don’t have the time or knowledge necessary to do so? If yes, then RJO Echo Trading is for you. RJO Echo Trading is a new intuitive way for investors or “echo followers” to automatically match the performance of veteran and accomplished traders. As an “Echo Follower” you will choose from a selection of proven, vetted, and experienced “Echo Leaders”, all you have to do is a pay a subscription fee and your account will mimic the trades of your chosen “Leader”. RJO Echo Trading eliminates the learning curve needed to trade futures, making it an option for all.
The Markets
Metals - Which Direction Will The Shiny One Go Next
Which Direction Will The Shiny One Go Next
By: Nicholas DeGeorgePosted 12/13/2019
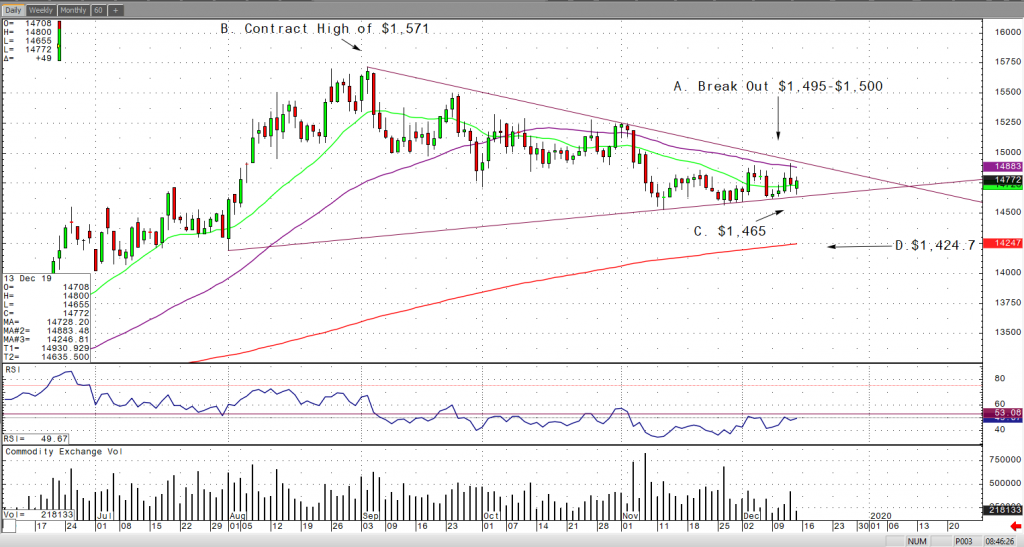
In the early morning trade, February gold is currently trading slightly in the green at $1,474.9 and its pretty surprising in the face of the two geopolitical events that have unfolded within the last 24 hours. First, is the U.S. China Phase I Trade Deal which was finalized “in principle”, which has left some gold investors skeptical down the road. However, in the near-term this could take a lot of safe-haven buying out of this market which could leave the bears in charge of the market. The other is the UK Conservative Party winning the British elections along with winning the majority in the House of Commons and is seen as a BIG win for National Sovereignty around the globe. After analyzing the two geopolitical situations the reason that gold is holding on to its overnight gains, is that the U.S. dollar has sold off and probably giving the shiny one some short-term support.
If you look at my daily February gold chart below, you’ll see that I highlighted four simple levels or ranges. The shiny one is coming to an end of its symmetrical triangle pattern and can break either way. For the gold bulls, if it breaks above the triangle, which I highlighted the prices below, then look for a rally up to the contract high of $1,571 made back in September. For the gold bulls, I would be a seller below today’s low of $1,465, which is also pretty much the bottom of the triangle, and then for a sell off down to its 200-day MA of $1,424.
Energy - Oil Drafts Support From Trade
Oil Drafts Support From Trade
By: Alexander Turro, Senior Market StrategistPosted Dec 13, 2019 9:48AM CT
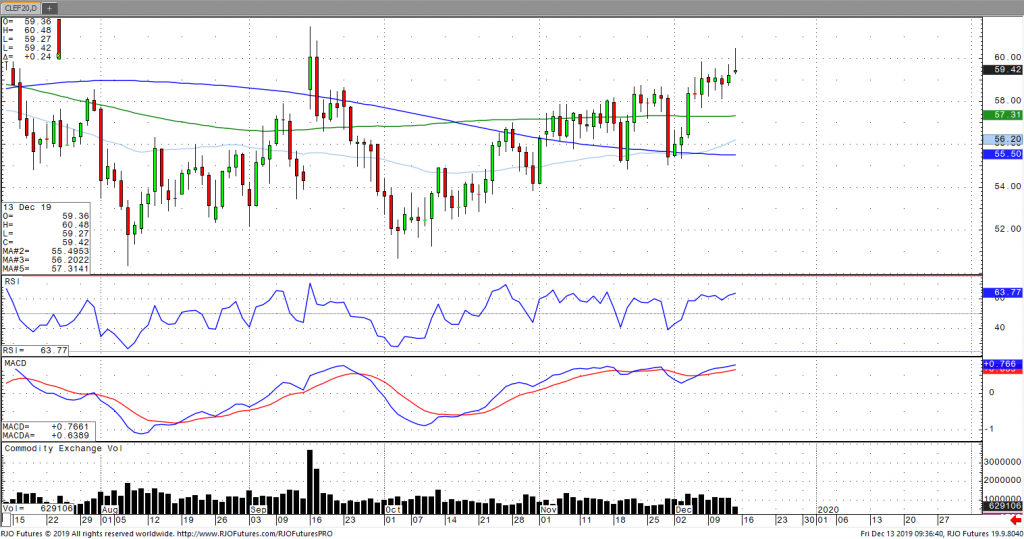
Oil prices have been lifted and are on three-month highs following reports of a ‘phase one’ deal being complete as well as a decisive victory by the UK conservative party. Oil prices had remained firm throughout the week on unabating optimism on trade despite a bearish API and EIA weekly crude stockpiles. Prior to, the outlook for oil demand had been clouded by ongoing negations with the upcoming December 15 deadline looming. This comes amidst OPEC and other major producers including Russia agreeing to curtail output by an additional 500k barrels a day through the first quarter of 2020 despite a recent report by the IEA stating that it was trimming its 2020 supply growth forecast by 200k barrels a day to 2.1 million barrels. However, expectations are for global inventories to increase by 700k a day in the first three months of 2020. Daily momentum is positive; however, the market is signaling immediate term overbought within its bullish trend with today’s range seen between 56.60 – 60.81.
If you have any questions or would like to discuss the markets further, please feel free to contact me at 800-438-4805 or aturro@rjofutures.com. Softs - Trade Deals, Brexit and Cocoa Futures
Trade Deals, Brexit and Cocoa Futures
By: Peter MoosesPosted 12/12/2019
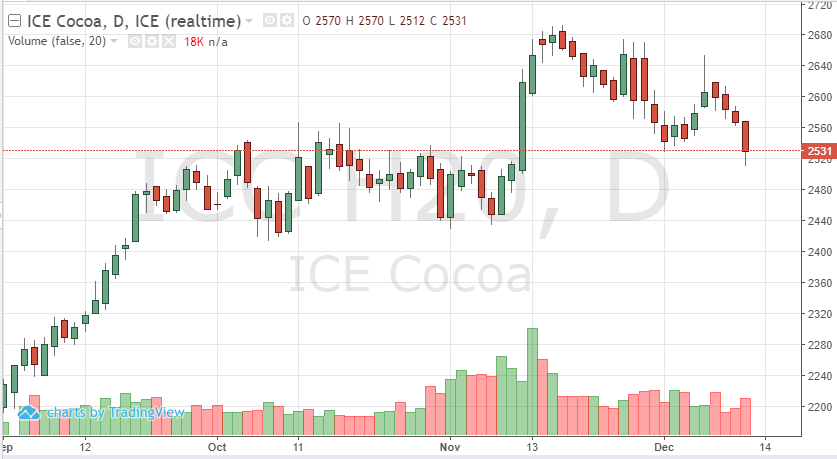
As
of Thursday, cocoa futures were down for the fourth straight session. After the
trade above 2600, traders took profit, causing some of this sell-off. As longs
liquidated this week, traders are deciding whether to take the sideline before
Brexit talks or reestablish positions. The markets should see volatility
overnight. Demand has been growing stronger in cocoa. The technicals continue
to give cocoa futures’ prices support as numbers have stayed above key moving
averages. All this could change with the news coming overseas Thursday night.
The euro and pound will be greatly affected by the coming news, which will
carry over to cocoa.
To
add to the current uncertainty in the markets, President Trump tweeted Thursday
implying a trade deal was near, causing equities to rally. This would affect
the Asian markets and the demand in cocoa from this part of the world. This
“unknown” will have traders guessing which side of the market to take.
Conservative
traders may look at buying options based on the direction they think the market
will take. Others will take a wait and see approach.
The Friday trade should be an interesting one in cocoa futures, as well as all global markets.
Softs - Coffee Continues Bull Run
Coffee Continues Bull Run
By: Adam TuiaanaPosted 12/10/2019
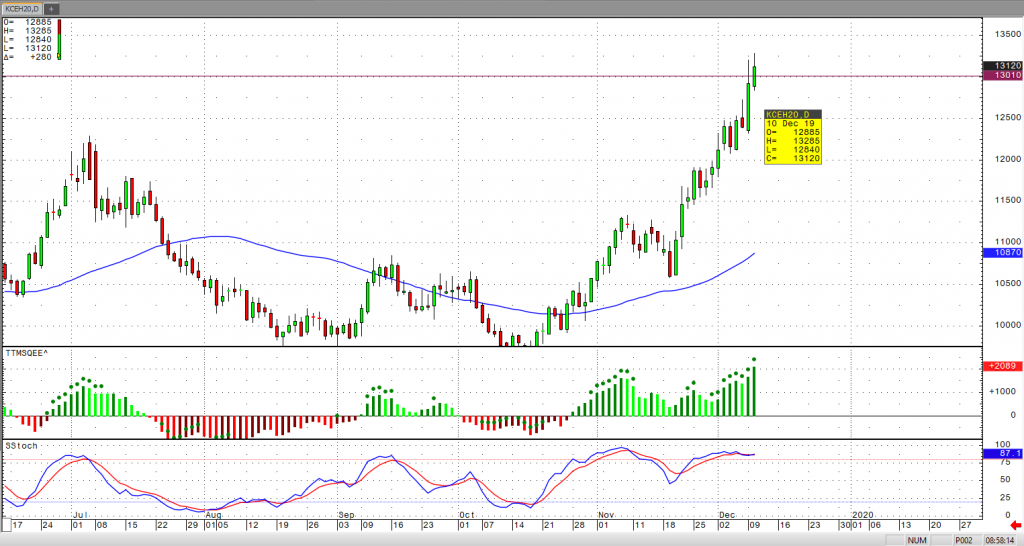
Tightening stocks are taking their toll on March
coffee prices, prompting continued aggressive buying along the way. On my last
article, I wrote “A break above the critical 119 resistance level will likely
spark continued aggressive buying over the next couple of weeks. A break above
the 120 level will begin to make a strong case for a reversal in the trend to
the upside. It may be a great time for bulls to jump in again once the pullback
reaches 114 support level.” With the exception of some run of the mill profit
taking, nothing in the foreseeable future has changed that could prompt coffee
to sell off from this point.
From a technical perspective, we have cleared several resistance areas mentioned in my last article, and the 130 level is not critical for holding support. With momentum and volume at high levels, the bull camp should continue to be in control until outside forces prompt otherwise.
On
the heels of mid-Sep-to-early-Oct's steeper, accelerated, 3rd-wave-looking
recovery, the past week-and-a-half's boringly lateral chop is first considered
a corrective/consolidative event that warns of a continuation of the uptrend
that preceded it to new highs above 04-Oct's 891.0 high. This count
remains consistent with our broader base/correction/recovery count introduced
in 13-Sep's Technical Blog following that
day's bullish divergence in short-term momentum above 07-Sep's 809.5 minor
corrective high detailed in the hourly chart below.
The
important takeaway from this month's lateral, sleepy price action is the
definition of Wed's 851.5 low as
the end or lower boundary of a suspected 4th-Wave correction. A failure
below 851.5 will confirm a bearish divergence in daily momentum and defer or
threaten a bullish count enough to warrant non-bullish decisions like
long-covers. A failure below 851.5 will not
necessarily negate a broader bullish count, but it will threaten it enough to
warrant defensive measures as the next pertinent technical levels below 851.5 are
13-Sep's prospective minor 1st-Wave high at 813.8 and obviously 08-Sep's 766.0
low. And making non-bullish decisions "down there" is
sub-optimal to say the least. Per such, both short- and longer-term
commercial traders are advised to pare or neutralize bullish exposure on a
failure below 851.5, acknowledging and accepting whipsaw risk- back above 04-Oct's
891.0 high- in exchange for much deeper and sub-optimal nominal risk below
766.0.
On
a broader scale, the daily log scale chart above shows the developing potential
for a bearish divergence in daily momentum that will be considered confirmed
below 851.5. This chart also shows the past month's recovery thus far
stalling in the immediate neighborhood of the (888.0) Fibonacci
minimum 38.2% retrace of Apr-Sep's entire 1128 - 766 decline). COMBINED
with a failure below 851.5, traders
would then need to be concerned with at least a larger-degree correction pf the
past month's rally and possibly a resumption of Apr-Sep's major downtrend.
Until
and unless the market fails below 851.5 however, we would
remind longer-term players of the key elements on which our bullish count is
predicated:
a confirmed bullish divergence in WEEKLY momentum
(below)
amidst
an
historically low 11% reading in out RJO Bullish Sentiment Index and
a
textbook complete and major 5-wave Elliott sequence down from 29-Apr's
1128 high to 08-Sep's 766.0 low.
Thus
far, the market is only a month into correcting a 4-MONTH, 32% drawdown, so
further and possibly protracted gains remain well within the bounds of a major
(suspected 2nd-Wave) correction of Apr-Sep's decline within an even more
massive PEAK/reversal process from 17-May's 1219 high on an active continuation
basis below.
These
issues considered, a bullish policy and exposure remain advised with a failure
below 851.5 required to defer or threaten this call enough to warrant moving to
a neutral/sideline position. In lieu of such weakness, we anticipate a
continuation of the past month's rally to new highs and potentially significant
gains above 891.0.
Agricultural - Trade Deal Means China Should be Buying More Soybeans
Trade Deal Means China Should be Buying More Soybeans
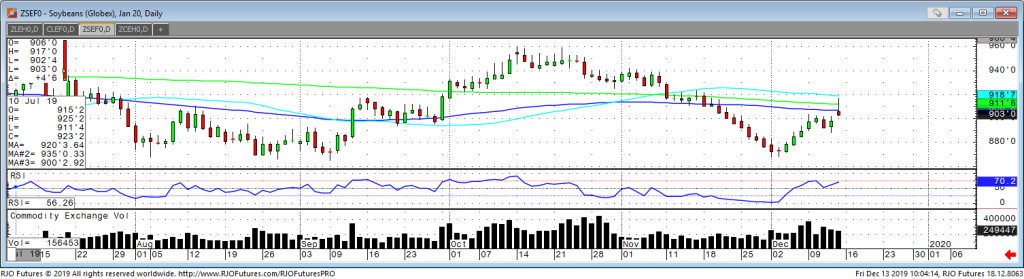
By: Tony Cholly, Senior Market StrategistPosted Dec 13, 2019 10:08AM CT
January soybeans were up 13-cents overnight and into this morning. Most agricultural and financial markets are trading as if the deal is completed and done. The gap of the downtrend channel is a bullish technical signal overnight as well. There are some strong indications that a deal is done for phase one on agricultural products, which is a step in the right direction to ease or eliminate tariffs. The news is thought to be bullish, but traders will await more details on these headlines. President Trump tweeted about “getting very close to a big deal” and the markets bounced off their lows and rallied. This shows the sensitivity the markets have to a deal getting done. March soybeans gapped the downtrend channel overnight which is a bullish technical development. Support today comes in at 891 and 883 while resistance is up around 905 and 910. Positive news on the trade deal should push the market up to resistance levels and possibly higher depending how strong the headlines are.
If you have any questions or would like to discuss the markets further, please feel free to contact me at 800-826-2270 or tcholly@rjofutures.com. Agricultural - Grain Futures Update w/Stephen Davis - 12/13/2019
Grain Futures Update w/Stephen Davis - 12/13/2019
By: Stephen DavisPosted 12/13/2019
Stephen Davis discusses this weeks movements in the grain markets. Currently, China is having the greatest effect on U.S. grains. A meeting with China was recently canceled by China due to the ongoing impeachment hearings in the U.S.
Currency - U.S. Dollar Index Gaps Lower on Repurchase Package
U.S. Dollar Index Gaps Lower on Repurchase Package
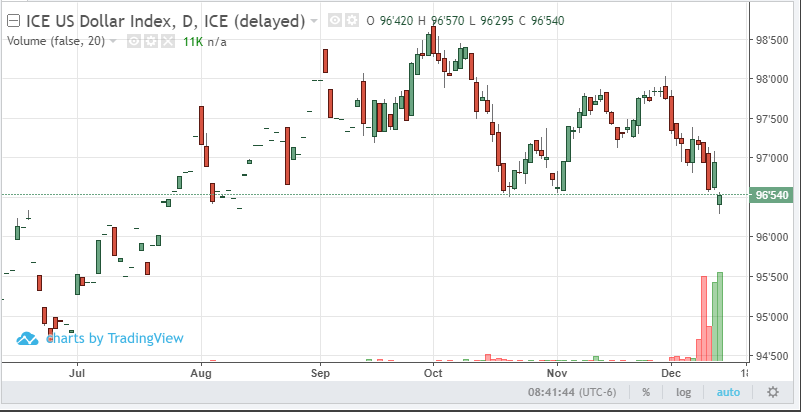
By: Ian BannonPosted 12/13/2019
U.S. dollar futures gapped lower overnight, breaching critical support at the 97 level. The sell-off follows Thursday’s news that the Federal Reserve will be buying over $300 billion worth of financial assets between today and mid-January. This short-term loan program serves to inject much needed liquidity into the U.S. economy, weakening the dollar and elevating foreign currencies by default. Many times, futures markets fill gaps on the chart, so a correction higher is entirely possible. However, if the dollar index closes below the 97-pivot point on Friday, it will likely cause additional sell-offs through the course of this repo operation. Compounding the selling pressure in the USD is the reelection of Britain’s prime minister, Boris Johnson. This triggered widespread buying in the pound, up 1.5% Friday morning. Expect to see the dollar put up a fight, but I believe the days of “King Dollar” are coming to an end, which will trigger a paradigm shift as to where institutional money is flowing.
Interest Rates - FOMC and Dec 15th Deadline Headline a Big Week for Interest Rates
FOMC and Dec 15th Deadline Headline a Big Week for Interest Rates
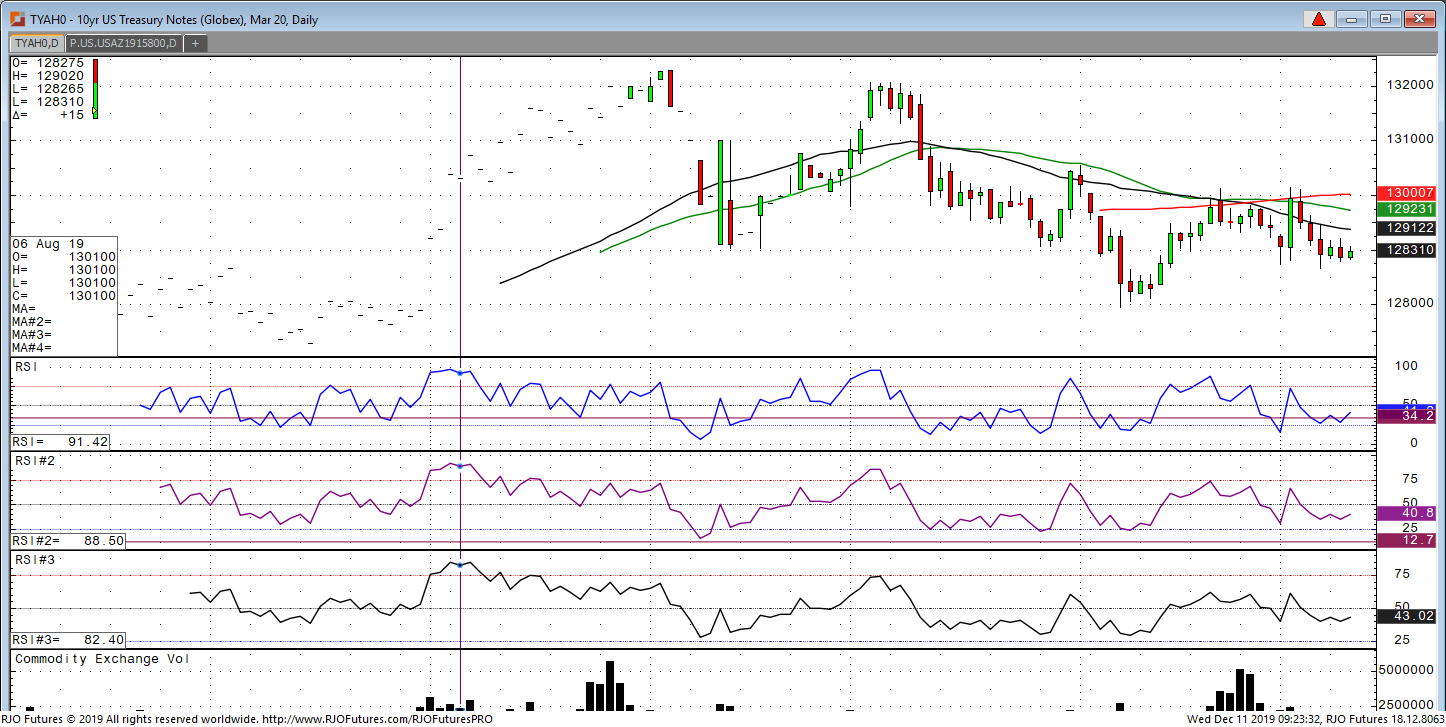
Looking at the 10-year note this morning, we have seen a narrow range of 128.265 on the downside and 128-02 on the upside while CPI came in pretty much as expected. The technical makeup of the contract looks a bit weak but is holding lows form last Friday’s payroll number of 128-21, so we could be forming an interim low. All eyes will be focused on the FOMC announcement which comes out at 1:00pm central. The Fed is widely expected to leave rates unchanged but more important will be Chairman Powell’s press conference. Traders will be scrutinizing very closely to see if Powell leans one way or another on how the economy looks and any possible future moves.
Another very important item that the treasuries will be watching for the remainder of the week is the announcement on whether Trump decides to increase tariffs on Chinese goods or not. December 15th is the day the tariffs are supposed to take effect. If Trump does go with the hike, I would expect a big move in the price of treasuries and down in yields and vice versa if there is no tariff increase. For the balance of today, I would expect very quiet price action until the announcement by the FOMC.
If you have any questions or would like to discuss the markets further, please feel free to contact me at 800-826-2270 or gperlin@rjofutures.com. Equity - Stock Market Rally Continues on Phase One Trade Deal
Stock Market Rally Continues on Phase One Trade Deal
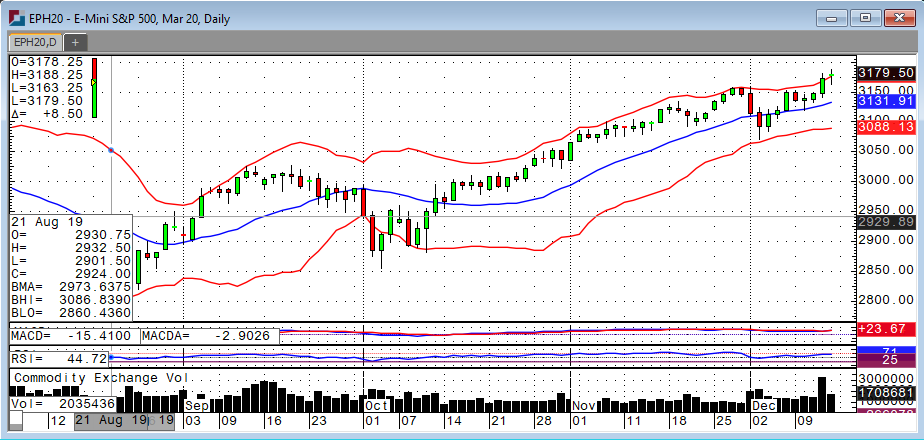
By: Ian BannonPosted 12/13/2019
Stock index futures continued their rally this week, closing at new highs on Thursday and trading higher overnight on news that a phase one deal trade with China has been signed by President Trump. Adding to the upside in stocks is the Fed’s announcement of a repurchase operation extending into mid-January. This adds liquidity to the economy, and liquidity is a friend of the stock market. Trade headlines own the news Friday morning, so the market seems to be shrugging off weaker-than-expected retail sales, coming in at 0.2% growth vs 0.5% expected. The “Santa Claus” rally seems to be alive and well. New highs were achieved during the Chinese press conference and a close over 3180 calls for a push over 3200! The market has now seen 45 days without a 1% move in either direction. This melt-up resembles the rally we saw during quarter one and is an extremely bullish pattern. With a phase one trade deal complete, the market will likely be looking for a phase two deal to emerge in the headlines going into early next year.
Economy - S-T Mo Failure Insufficient to End RBOB Correction, But Beware
S-T Mo Failure Insufficient to End RBOB Correction, But Beware
By: RJO Market InsightsPosted 11/08/2022
Posted on Nov 08, 2022, 07:51 by Dave Toth
In Fri's Technical Webcast we identified a
minor corrective low at 2.6328 from Thur as a mini risk parameter the market
needed to sustain gains above to maintain a more immediate bullish count.
The 240-min chart below shows the market's failure overnight below this level,
confirming a bearish divergence in very short-term momentum. This mo
failure defines Fri's 2.8172 high as
one of developing importance and a parameter from which very short-term traders
can objectively base non-bullish decisions like long-covers.
Given
the magnitude of the past three weeks' broader recovery however, this
short-term momentum failure is of an insufficient scale to conclude anything
more than another correction within this broader recovery from 26-Sep's 2.1877
low. Indeed, overnights failure below 2.6328 only allows us to conclude
the end of the portion of the month-and-a-half rally from 31-Oct's 2.4822 next
larger-degree corrective low. 2.4822 is the
risk parameter this market still needs to fail below to break the uptrend from
18-Oct's 2.3526 low while this 2.3526 low
remains intact as the risk parameter this market needs to fail below to break
the month-and-a-half uptrend. From an
intermediate-to-longer-term perspective, this week's setback falls well within
the bounds of another correction ahead of further gains. This is another
excellent example of the importance of technical and trading SCALE and
understanding and matching directional risk exposure to one's personal risk
profile.
The
reason overnight's admittedly minor mo failure might have longer-term
importance is the 2.8172-area from which it stemmed. In
Fri's Technical Blog we also noted the market's engagement of the
2.8076-to-2.8159-area marked by the 61.8% retrace of Jun0-Sewp's 3.2758 -2.1877
decline and the 1.000 progression of Sep-Oct's initial 2.1877 - 2.6185
(suspected a-Wave) rally from 18-Oct's 2.3526 (suspected b-Wave) low. We
remind longer-term players that because of the unique and compelling confluence
of:
early-Aug's bearish divergence in WEEKLY momentum
amidst
historically
extreme bullish sentiment/contrary opinion levels in our RJO Bullish
Sentiment Index
an
arguably complete and massive 5-wave Elliott sequence from Mar'20's 0.4605
low to Jun's 4.3260 high (as labeled in the weekly log active-continuation
chart below) and
the
5-wave impulsive sub-division of Jun-Sep's (suspected initial 1st-Wave) decline
The
recovery attempt from 26-Sep's 2.1877 low is arguably only a 3-wave (Wave-2)
corrective rebuttal to Jun-Sep's decline within a massive, multi-quarter
PEAK/reversal process. Now granted, due to the magnitude of 2020 -2022's
secular bull market, we discussed the prospect for this (2nd-Wave corrective)
recovery to be "extensive" in terms of both price and time. A
"more extensive" correction is typified by a retracement of 61.8% or
more and spanning weeks or even months following a 3-month decline. Per
such, the (suspected corrective) recovery from 26-Sep's 2.1877 low could easily
have further to go, with commensurately larger-degree weakness than that
exhibited this week (i.e., a failure below at least 2.4822) required
to consider the correction complete. Indeed, the daily log chart above
shows the market thus far respecting former 2.6185-area resistance from 10-Oct
as a new support candidate.
These
issues considered, very shorter-term traders have been advised to move to a neutral/sideline
position following overnight's momentum failure below 2.6328, with a recovery
above 2.8172 required to negate this call, reaffirm the recovery and re-expose
potentially significant gains thereafter. For intermediate- and
longer-term players, a bullish policy and exposure remain advised with a
failure below 2.4822 required to threaten this call enough to warrant
neutralizing exposure. We will be watchful for another bearish divergence
in momentum following a recovery attempt that falls short of Fri's 2.8172 high
that would be considered the next reinforcing factor to a count calling that
2.8172 high the prospective end to the month-and-a-half 2nd-Wave
correction. In lieu of such, a resumption of the current rally to
eventual new highs above 2.8172 should not surprise.