For beginning investors, technical analysis may seem somewhat daunting, given the specialized terminology and chart analysis that’s involved.
The truth, however, is that virtually anyone can master the basics of technical analysis in a reasonably short time, adding a powerful new tool to their trading repertoire.
To help you begin this process, let’s review the philosophy that supports technical trading, and some of the most important technical analysis concepts to learn before you get started.
Technical Analysis Explained
 Fundamental analysis is the attempt to evaluate the intrinsic value of a security or business through the examination of financial data and other variables. Technical analysis charts a distinctly different path, evaluating securities by analyzing trading activity.
Instead of evaluating an asset’s revenue, expenses, liabilities, etc., a technical analyst considers variables such as price movement or trading volume. By doing so, a technical analyst can better understand price trends and market sentiment and identify trading opportunities as they occur.
Technical analysis isn’t applicable only in the realm of equities, of course. It’s used to identify trading opportunities in futures, commodities, cryptocurrencies and other areas.
Those who are new to the discipline should begin by focusing on a few cornerstone concepts.
Basic Technical Analysis Concepts and Terms
One of the first things to understand about technical analysis is that it comes in many forms. Though traders use many techniques (chart patterns, indicators, etc.) all of their efforts are centered on the analysis of price and volume data.
Many — if not most — technical analysts believe that fundamental factors are already priced into assets, a concept known as the Efficient Market Hypothesis. Because prices reflect all currently available data, it then becomes imperative to analyze price movements to identify trading opportunities based on trends and patterns that can manifest over both the short and long term.
Spotting and understanding how these trends work is a basic task for technical traders. Trends on a chart tend to move sharply up and down, reflecting price increases and decreases.
 An uptrend, for example, can be identified as a series of higher highs and higher lows, while in a downtrend the reverse is true. Trends on a chart either move up, down, or sideways (a sideways trend indicates a lack of movement in either direction).
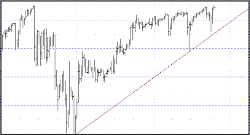
Trendlines, on the other hand, are a simple line drawn on the chart that shows the direction the trend is heading. These lines are an essential tool for identifying overall trends and identifying two more key concepts: support and resistance.
Support vs Resistance
Support refers to a point where a price has repeatedly rebounded higher; resistance identifies where prices have repeatedly bounced lower. When the price of an asset drops, buying pressure creates support; when the price of an asset rises, selling pressure creates resistance.
In theory, support and resistance act as brakes that stop a price from moving in one direction, until these levels are broken.
 Understanding support and resistance is critical because they help traders decide their entry and exit points. Once a support or resistance level is reached, a trader can enter the market and choose which direction he thinks the price will move. If he chooses right, a substantial gain may be realized, but if he chooses wrong, he may exit the trade quickly and accrue only a minor loss.
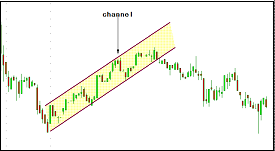
Technical analysts may also identify a channel by using two trendlines on the chart (a top and bottom) to identify support and resistance levels and price movements in between them.
Key Terms to Know
Now that we’ve discussed some of the philosophy behind technical analysis and a few of the key concepts, let’s briefly look at a few other key ideas and indicators:
- Volume. By evaluating volume, technical analysts can gauge the strength of price movements. Higher volume typically means greater confidence in a pattern or trend. Volume is also a leading indicator on price shifts.
- Chart patterns. These are, quite literally, patterns that appear on a chart that indicate things such as reversals or continuations. For example, a head and shoulders pattern (which appears as three peaks on the chart with the middle peak elevated) indicates a probable trend reversal. Other patterns include triangles, cup and handle formations, flags and pennants etc.
- Moving averages. A basic moving average takes the total value of all closing prices over a specified time period and then divides that figure by the number of prices. This can help traders identify possible exit and entry opportunities.
- Indicators. Technical traders also use indicators (such as the moving average convergence-divergence, or MACD). Some of these indicators are quite complex, however, and should be studied after the basics are mastered.
Learn Technical Analysis in Trading
Fundamental and technical analysis should ideally work in tandem to help investors maximize returns. One simple formulation to consider is this: Fundamental analysis can help you select the right assets, but technical analysis should be employed to help you trade those assets.
By mastering the basics of technical analysis, you can now learn technical analysis in trading, adding a valuable tool to your trading plan and make your decisions about entries and exits with more confidence.
There’s More! Now that you’ve read the basics, download our Technical Analysis Trading Guide here to get an in-depth discussion of over 30 different technical chart types and formations to learn technical analysis in trading.


