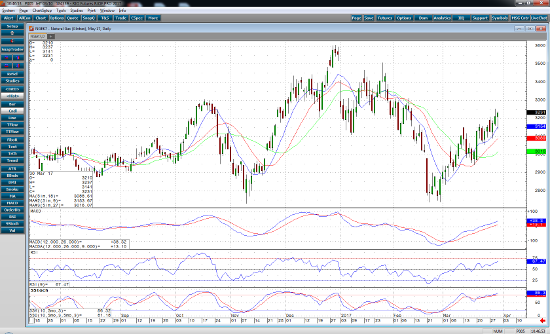
The overall trend in the May Natural gas contract is up. Resistance on a daily chart is at 3.255 – 3.270. A close above 3.310 signals a breakout targeting 3.400 to the upside. Momentum studies MACD, Slow Stochastics, and RSI are all above mid-levels, and headed North.
Close in support is at 3.190. Below that, the 3.150-3.140 range stands out as strong support, and a close below 3.060 would violate a corrective low and negate the current trend. New short plays can be initiated at this point.
Larger than expected draws support the price action here. We got a -43 bcf draw today in the natural gas storage number, as opposed to an expected draw of-37 bcf. Both numbers are greater than the 5 year average of 27 bcf. A late winter, and an early spring blast of arctic air sent the mercury plummeting below average temps, accounting for the larger than expected draw.
Good export numbers are also supportive of natural gas prices, which are the highest they have been since Feb. during the peak of heating season. Exposure to the long side is recommended until technical damage is done to the charts. You may consider long May contracts or long May call spreads for the short term run up.


