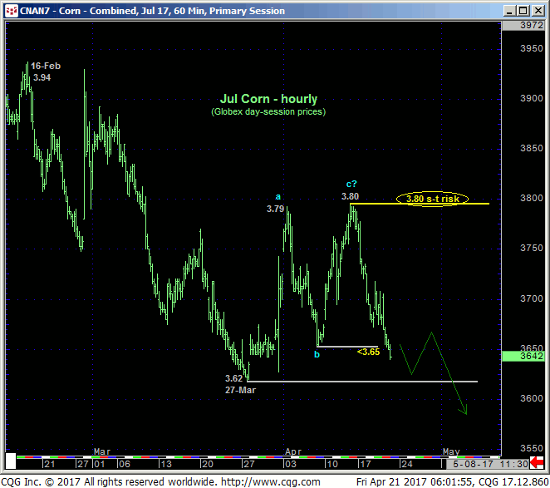
Ahhh, the trials and tribulations of the range-center, chop-city blues. 03-Apr’s recovery discussed in that day’s Technical Blog stemmed the sell-off attempt from 16-Feb’s 3.94 high in the now-prompt Jul contract and, along with historically bearish sentiment, exposed something potentially bigger to the upside. Three weeks on, the market’s failure yesterday below 07-Apr’s 3.65 low renders this month’s recovery attempt a 3-wave affair as labeled in the hourly chart below. Left unaltered by a recovery above 13-Apr’s 3.80 high and new short-term risk parameter, this 3-wave recovery attempt is considered a corrective/consolidative event that warns of a resumption of Feb-Mar’s downtrend that preceded it.
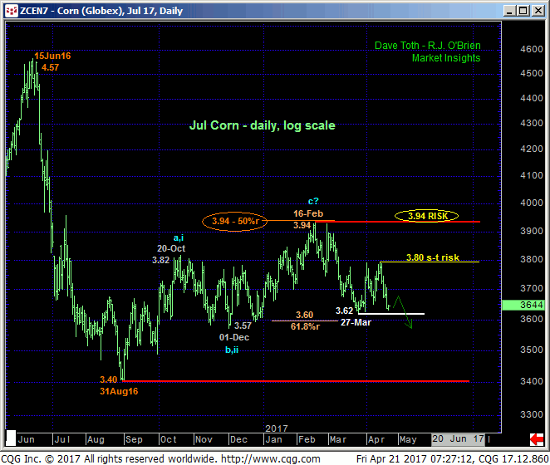
While it’s risky to place too much importance on choppy, aimless price action typical of the middle-halves of long-established ranges, this week’s admittedly smaller-degree relapse could have farther reaching consequences following a break below 27-Mar’s 3.62 low. For, indeed, Feb-Mar’s relapse and now the pending resumption of that slide reinforces 16-Feb’s 3.94 high as the END of a textbook 3-wave correction from 31Aug16’s 3.40 low. The daily log scale chart above shows that Aug-Feb’s entire 5-1/2-MONTH recovery attempt stalled at the exact (3.94) 50% retrace of Jun-Aug’16’s 4.57 – 3.40 meltdown, reinforcing the bear market correction count.
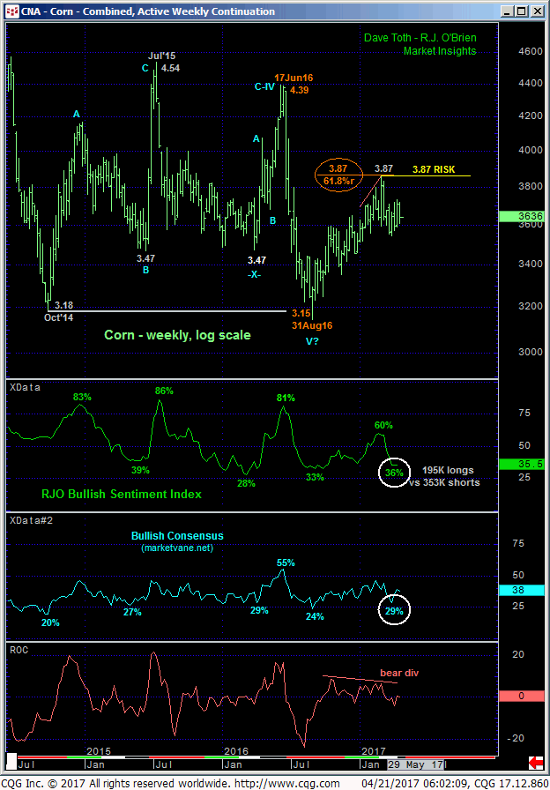
On a weekly log scale active-continuation chart basis below, Aug-Feb’s recovery stalled at the exact (3.87) 61.8% retracement of last year’s plunge. Combined with a bearish divergence in WEEKLY momentum, it’s not hard to see the prospect for a sharp, trendy, impulsive resumption of 2016’s collapse. And such a resumed slide could become much more obvious and even relentless if/when the market breaks 27-Mar’s 3.62 low.
Market sentiment remains historically low and continues to warn of a BASE/reversal threat that could be major in scope. But as we discuss below, this factor could remain in place and contribute to that reversal after another fundamental-headline-prompting plunge.
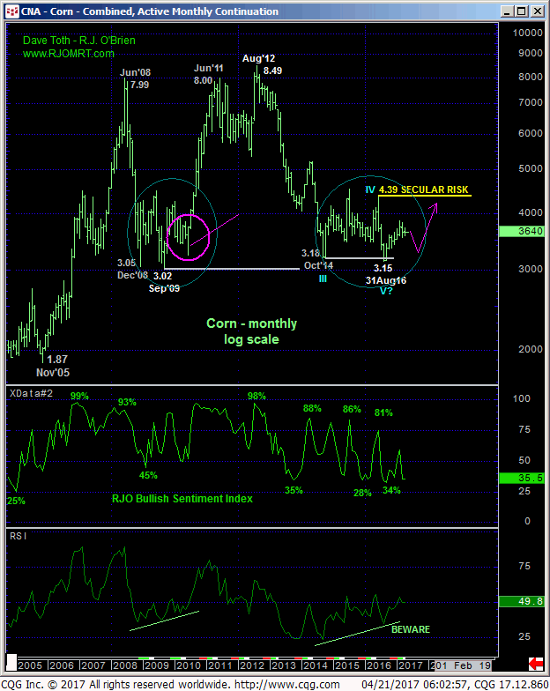
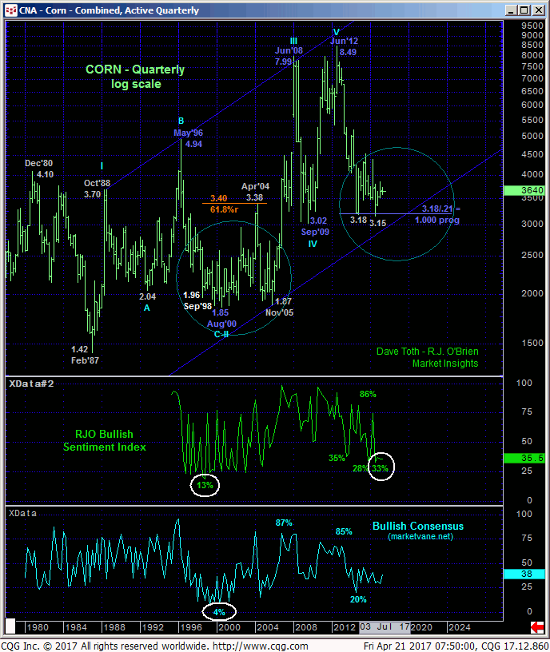
We’d like to remind traders of what we still believe is an absolutely major, multi-year BASE/REVERSAL environment that dates from Oct’14’s 3.18 low that we’re equating to prior such reversals starting in Dec 2008 and Sep 1998 circled in the monthly log scale chart above and quarterly log scale chart below. The challenge with such reversal PROCESSES is that they can be extraordinarily extensive in terms of both price relapse AND TIME.
To negate our long-term bullish count all the market has to do is take out Aug’16’s 3.15 low. Relapse attempts shy of breaking that low- even sharp, impulsive ones like that that could follow a sub-3.62 break- could prove to be outstanding risk/reward BUYING opportunities if the market stems that break with a bullish divergence in momentum somewhere above 3.15 amidst what will likely be even more bearish sentiment levels. But we’ll cross that opportunistic bridge if/when we get there.
In the meantime and as a result of this week’s relapse, shorter-term traders are advised to re-join longer-term players with a return to a cautious bearish policy on the immediate break below 3.62 in the Jul contract. Subsequent strength above at least 3.72 (micro risk parameter) and preferably 3.80 would then be required to threaten and then negate that call. In lieu of such subsequent strength a break below 3.62 could expose a sharper, trendier assault on the Jul contract’s 31Aug16 low at 3.40 AND BELOW.
