JUN E-MINI S&P 500
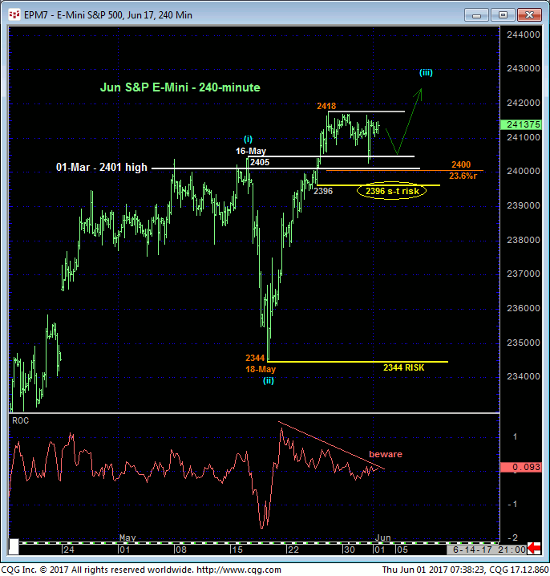
We’re going to begin our T-Note update with some S&P techs given these two markets’ tendency for a relative inverse correlation. Since 25-May’s breakout to another round of new all-time highs, the market continues to behave like a bull with mere lateral, corrective price action SUSTAINED ABOVE a ton of former resistance around 2405-to-2400 that would be expected to hold as new support if the market is still truly strong “up here”. Weakness below at least the 2400-area in general and below an intra-day corrective low at 2396 specifically is required to even defer, let alone threaten the secular advance with a bearish divergence in short-term mo. The past week’s lateral chop has failed to retrace even a Fibonacci minimum 23.6% (to 2400) of the past couple weeks’ rally from 2344 to 2418, underscoring its overall strength.
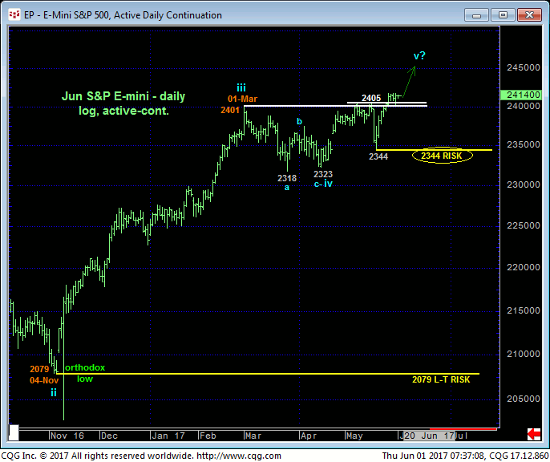
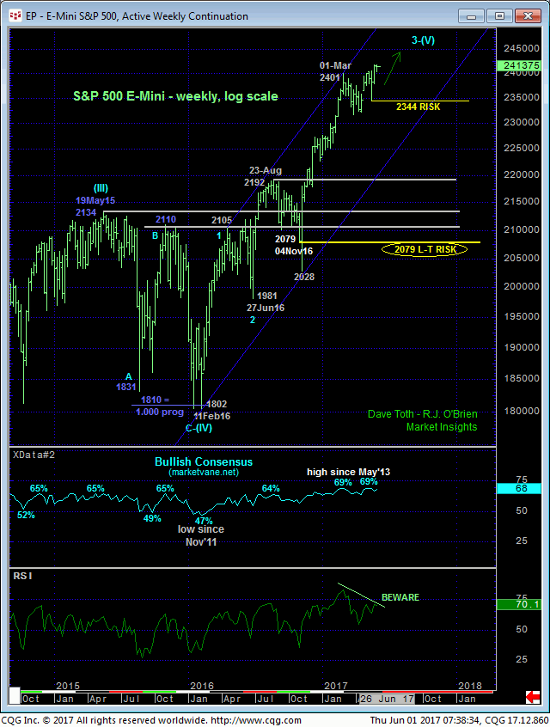
Only a glance at the daily (above) and weekly (below) log scale charts is needed to see that the trend remains up on all scales with ALL pertinent technical levels existing ONLY BELOW the market in the form of former resistance-turned-support (2400) and prior corrective lows like 2396 (tight) and 18-May’s 2344 larger-degree corrective low and key risk parameter. Until and unless this market fails below these corrective lows, there is no objective technical reason to believe the market will do anything other than continue or even accelerate its uptrend.
Per such, a full bullish policy and exposure remain advised with weakness below at least 2396 required to even defer the bull. And given the relative inverse correlation between the S&P 500 and T-notes, this continued bullish call on stocks would be more of a contributing factor to a peak/reversal environment in T-notes rather than a deterrent.
SEP 10-Yr T-NOTES
Two things stand out in the 240-min chart of the now-prompt Sep T-note contract: The market’s proximity to the extreme upper recesses of the past couple weeks’ range and this morning’s bearish divergence in very short-term momentum below yesterday morning’s 125.315 minor corrective low. This confirmed bearish divergence in momentum defines yesterday’s 126.10 high as one of developing importance, the END of the recent recovery from last week’s 125.145 low and possibly a more extensive peak/reversal-threat environment.
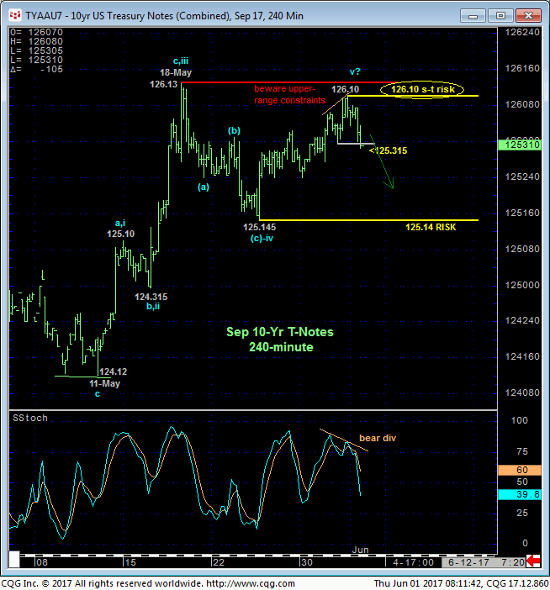
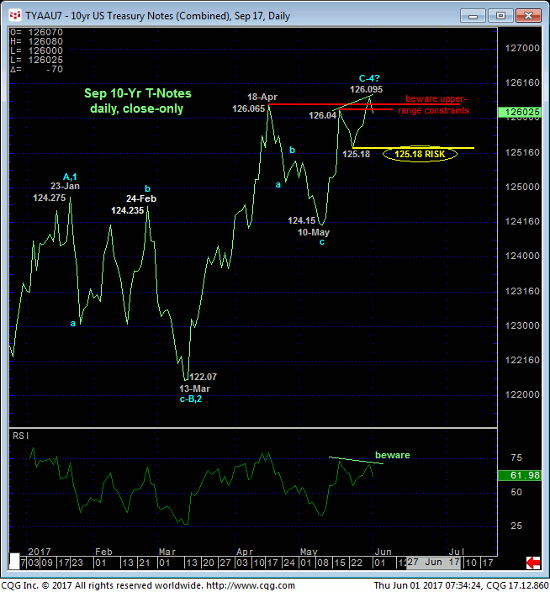
While the recent rally failed to take out 18-May’s 126.13 intra-day high before this morning’s mo failure, we find it very interesting and perhaps opportunistic that, on a daily close-only basis above, yesterday’s 126.095 close breached all of the past FIVE WEEKS’ high closes. Amidst the nicely developing POTENTIAL for a bearish divergence in momentum on this larger scale, today’s bearish divergence in admittedly short-term mo cannot be overlooked as a possible baby step in a peak/reversal environment of a much broader scale.
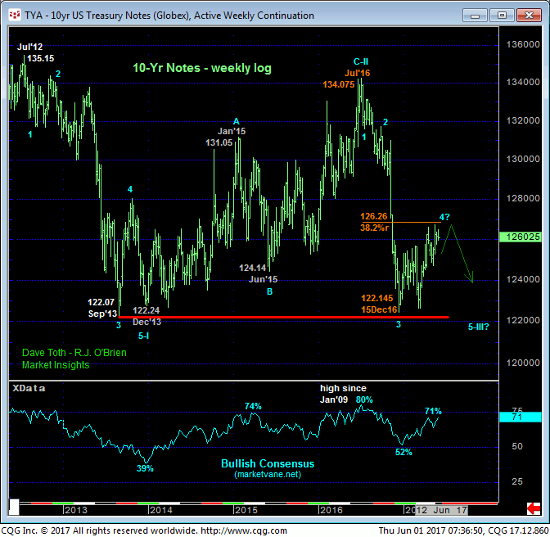
Traders are reminded that on an even longer-term time frame shown in the weekly chart below, the past five months’ recovery attempt still falls well within the bounds of a mere correction to last year’s major downtrend, a downtrend that we believe is a component of a new secular bear market in T-note prices that could span a generation.
Commensurately larger-degree proof of weakness below 24-May’s 125.14 corrective low and key risk parameter (and/or below 23-May’s 125.18 corrective low close) remains required to CONFIRM a bearish divergence in daily momentum and a scale sufficient to conclude a more significant peak/reversal count. Nonetheless, this morning’s weakness is sufficient for shorter-term traders to move to a neutral-to-cautiously-bearish stance and for longer-term players to pare bullish exposure to more conservative levels until negated by resumed gains above 126.10. For a cautious way to enter into a bearish position ahead of tomorrow’s eky nonfarm payroll report, please see the option strategy below.
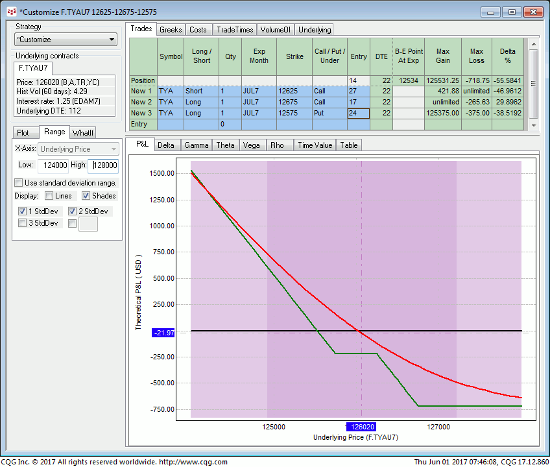
Given the potential wildcard that is tomorrow’s key nonfarm payroll report, the Short Jul 126-1/4 – 126.3/4 Call Spread – Long Jul 125-3/4 Put “Combo” provides a way to position for bearish profits AND get a good night sleep tonight. This strategy involves selling the Jul 126-1/2 – 126-3/4 Call Spread for around 10/64s and buying the Jul 125-3/4 Puts around 24/64s for a net cost of 14/64s ($281 per 1-lot position) and provides:
- a current net delta of -0.46
- favorable margin rates
- fixed maximum cost of 23/64s on ANY rally above 126.25
-
- (NOTE: this maximum risk may be able to be reduced by covering this strategy on a technical breakout above our 126.10 short-term risk parameter)
- unlimited profit potential below its 125.16 breakeven point at expiration 22 days from now on 23-Jun.
Please contact your RJO representative for an updated bid/offer quote on the Short Jul 126-1/4 – 126.3/4 Call Spread – Long Jul 125-3/4 Put “Combo”.
