JUL COFFEE
The market’s not unexpected break overnight below 25-May’s 127.15 low reaffirms once again the major bear trend and leaves 31-May’s 133.40 high in its wake as the latest smaller-degree corrective high it’s now minimally required to recoup to threaten the longer-term downtrend. In this regard 133.40 becomes our new short-term risk parameter from which shorter-term traders with tighter risk profiles can objectively rebase and manage the risk of a still-advised bearish policy and exposure.
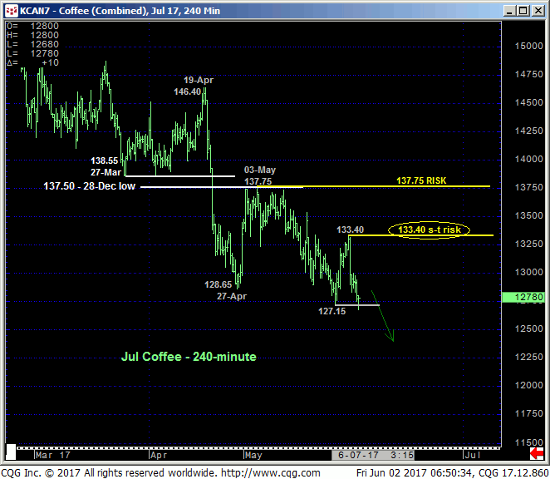
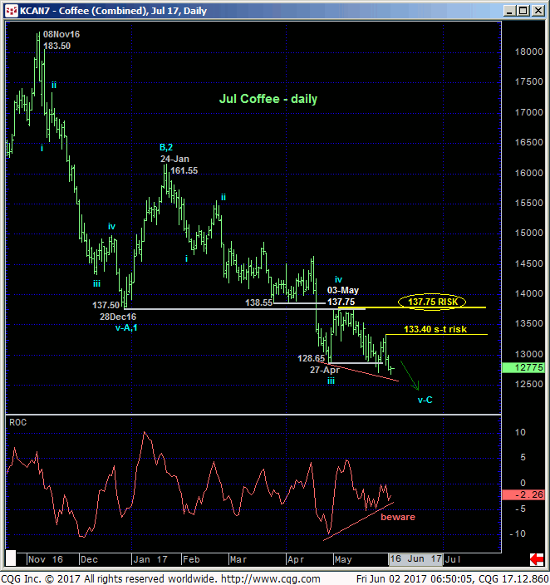
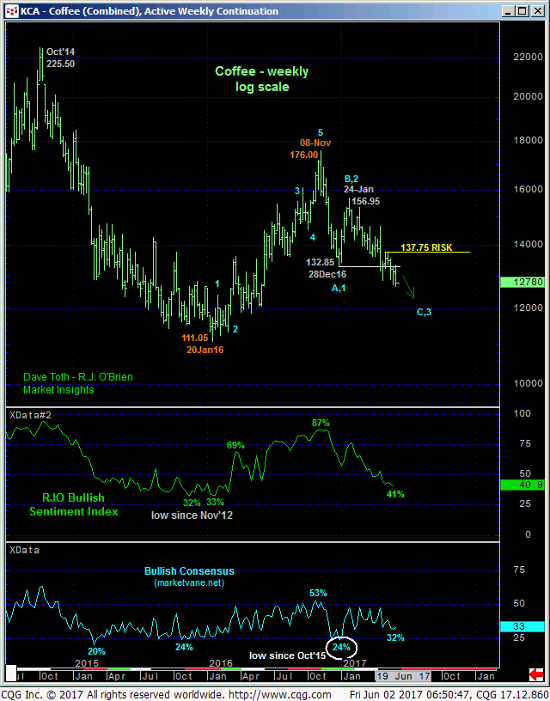
Only a glance at the daily (above) and weekly log scale (below) charts is needed to see that the trend is down on all scales with EVERY pertinent technical level now existing ONLY ABOVE the market in the form of prior corrective highs like 133.40 and 03-May’s pivotal 137.75 next larger-degree corrective high we’ve been discussing since 12-May’s Technical Blog . It is clear by the rate-of-change momentum indicator that the RATE of decline has slowed since late-Apr. this remains a threat to the broader bear trend. BUT ONLY PROOF of “non-weakness” above levels like 133.40 and especially 137.75 will be objective cause to veer from a bearish policy. ALL “derived” technical levels below the market are TOTALLY USELESS without such a confirmed bullish divergence in momentum needed to, in fact, threaten or break the simple downtrend pattern of lower lows and lower highs. And until such proof materializes, the market’s downside potential remains indeterminable and potentially steep.
In sum, a bearish policy remains advised with strength above at least 133.40 required to threaten this call.
JUL SUGAR
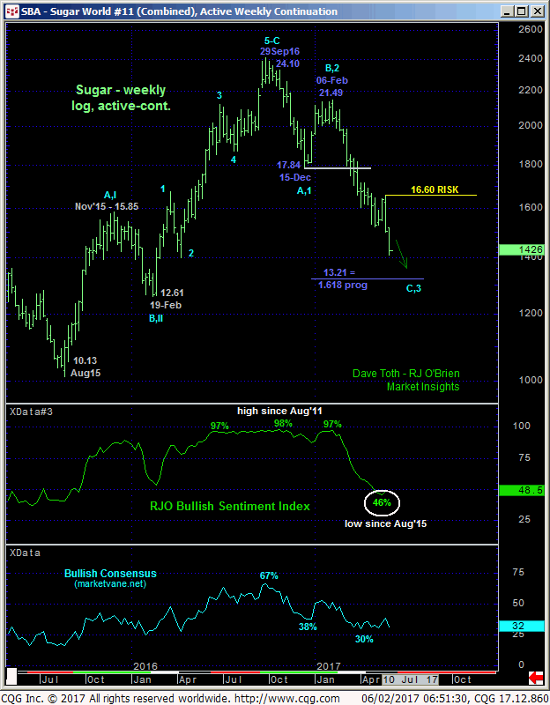
This one’s easy: the trend remains down on all scales and is expected to continue until threatened by a recovery above at least a very minor, intra-day corrective high from yesterday at 15.01 detailed in the 240-min chart below.
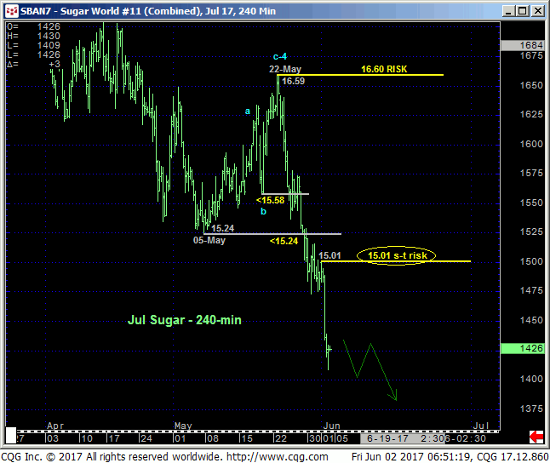
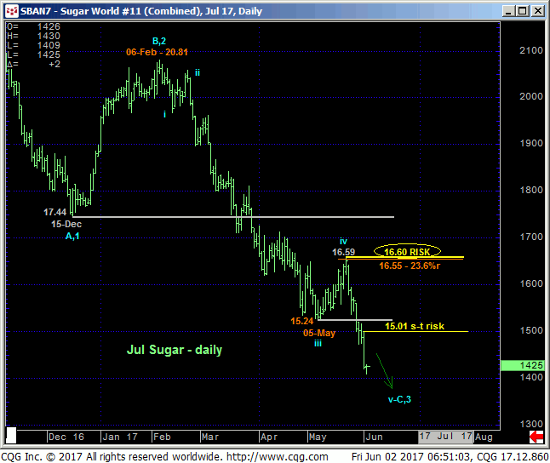
References to this market being “oversold” are, as always, ridiculous, irresponsible and outside the bounds of technical discipline as the momentum indicator “tail” never ever wags the underlying market “dog”. In sum, a full and aggressive bearish policy and exposure remains advised with minimum strength above 15.01 required to even defer, let alone threaten this count. In lieu of such strength further and possibly severe losses remain expected with downside potential remaining indeterminable.
