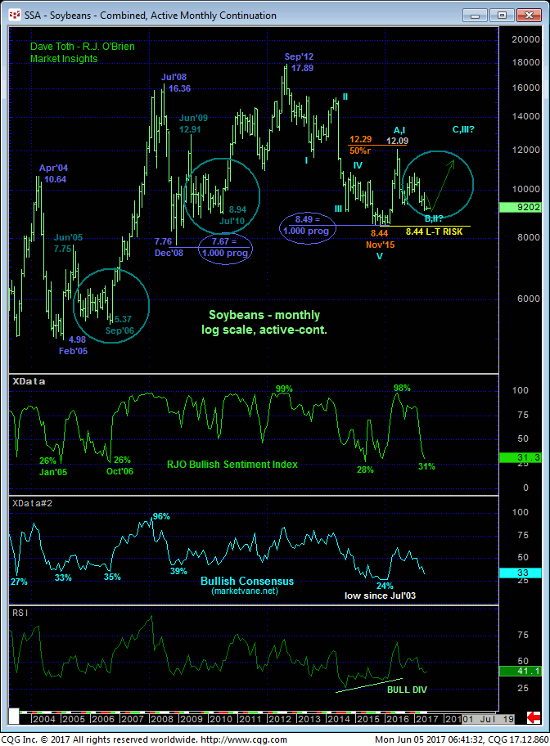
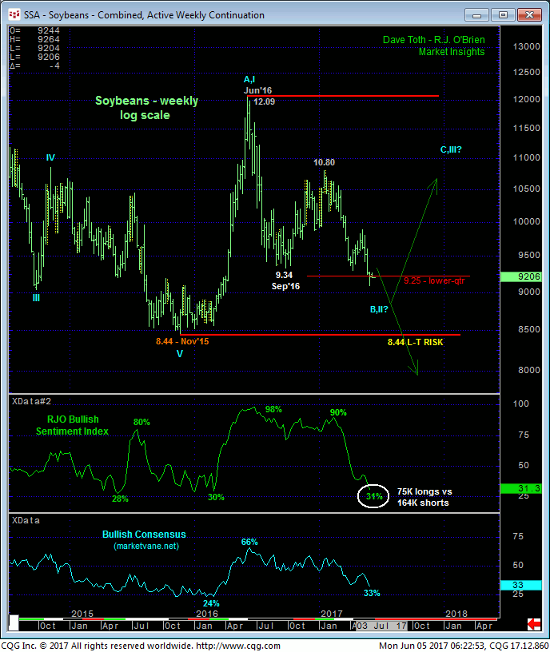
Almost three months ago in 09-Mar’s Technical Blog when our RJO Bullish Sentiment Index teetered at 83% resulting from 167K Managed Money long positions to just 35K shorts, we discussed not only the market’s vulnerability to sharp losses to the 9.25-area or lower, but also the prospect that if such a plunge was a sub-component of our major BASE/reversal count from Nov’15’s 8.44 low shown in the monthly log scale chart above, that fundamental and emotional circumstances were likely to become “obviously bearish” during the plunge. This is exactly what has transpired since then with the market forcing the capitulation of those long-&-wrong Feb and Mar positions and the RJO BSI dropping to a historically low 31% reading currently. Now, this figure represents just 75K Managed Money long positions versus 164K shorts, a contrary opinion condition much more typical of major BASE/reversal-threat environments.
Indeed, time and time and time again the two contrary opinion indicators we’ve relied on religiously for decades- the Bullish Consensus (marketvane.net) and our proprietary RJO Bullish Sentiment Index– show that the huddled masses are typically most bullish right at the tops of major bull trends and most bearish right into the bottoms of major bear trends. The technical key is to know when to RELY on contrary opinion theory as an APPLICABLE technical tool in navigating a reversal as such historically extreme views and emotion can sustain itself for months while the clear and present downtrend simply keeps on keepin’ on.
To us the answer is a simple one: MOMENTUM. We believe that contrary opinion theory is not an applicable technical tool in the absence of a confirmed bullish divergence in momentum needed to stem the clear and present downtrend. Given the clear and present downtrend that has dominated this market since mid-Jan and that was resurrected with 12-May’s bearish divergence in momentum, only a confirmed bullish divergence in momentum is standing in the way of a multi-quarter BASE/reversal process and a resumption of the 5-year secular bear trend to new lows below 8.44.
IF our long-term base/reversal count is correct, we believe the lower-quarter (i.e. <9.25) of the past couple years’ range between 12.09 and Nov’15’s 8.44 low will house the (B- or 2nd-Wave) correction of Nov’15 – Jun’16’s 8.44 – 12.09 rally and present one of the great risk/reward buying opportunities for the second-half of 2017. If, alternatively, 2016’s recovery was a mere correction within the still-unfolding secular bear trend from 2012’s 17.89 all-time high, then we’d expect the past couple weeks’ obvious break below last Sep’s 9.34 low to expose a trendy, impulsive stage of the resumed bear that should be increasingly obvious and punishing.
JUL SOYBEANS
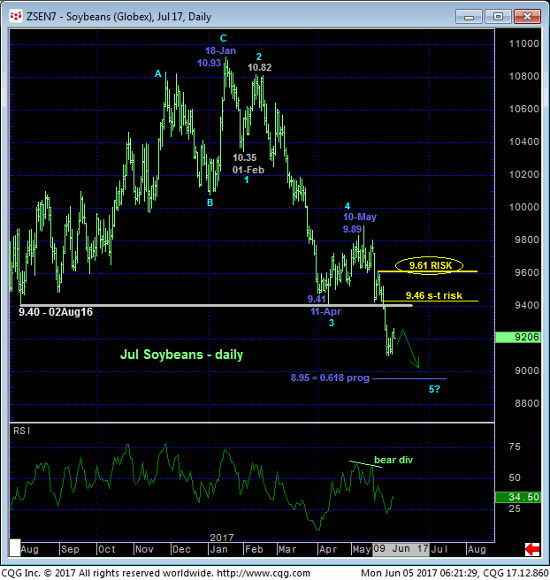
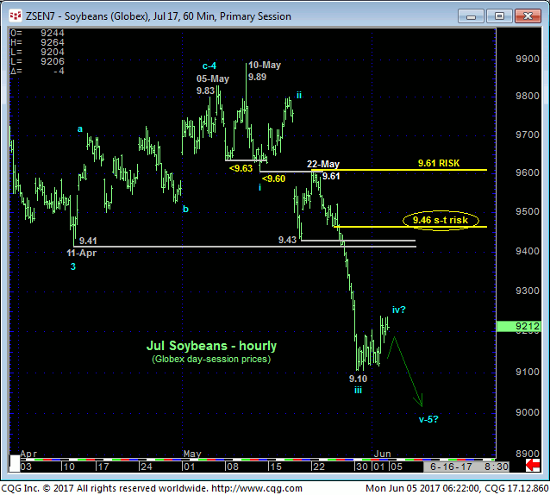
11-May’s bearish divergence in short-term mo stemmed the Apr-May recovery attempt, rendered it a 3-wave and thus corrective affair and resurrected our longer-term bearish count calling for an assault on the lower-quarter of the 2-year range. The extent of 25/26-May’s subsequent collapse below the 9.43-to-9.41-area support was a clear and decisive reaffirmation of the clear and present downtrend and a bearish count that has presented NO technical factors to suggest anything but a bearish policy was still warranted. References to technical buying from a key reversal were unfounded.
Now-former 9.41-to-9.43-area support is a key new resistance candidate with a recovery above a very minor, interim low at 9.46 from 24-May minimally required to jeopardize the impulsive integrity of a still-bearish count. We strongly suspect that the past few days’ bounce from last week’s 9.10 low is a minor correction that will yield to the broader bear and new lows. Once sub-9.10 lows are achieved, the high to the current bounce will become our new short-term risk parameter to a bearish policy and a potentially pivotal one around which a broader BASE/reversal count might ultimately be navigated.
From a longer-term perspective we believe 22-May’s 9.61 corrective high presents the tightest but sufficiently larger-degree corrective high this market needs to recoup to mitigate a broader bearish count and contribute to a base/reversal count that will once again have the masses on the wrong side of the market at a critical point. In sum, a bearish policy and exposure remain advised with strength above 9.46 required to threaten this call and subsequent strength above 9.61 required to negate it and warn of a major base/reversal environment. IN lieu of such strength further and possibly extensive losses remain expected.
NOV SOYBEANS
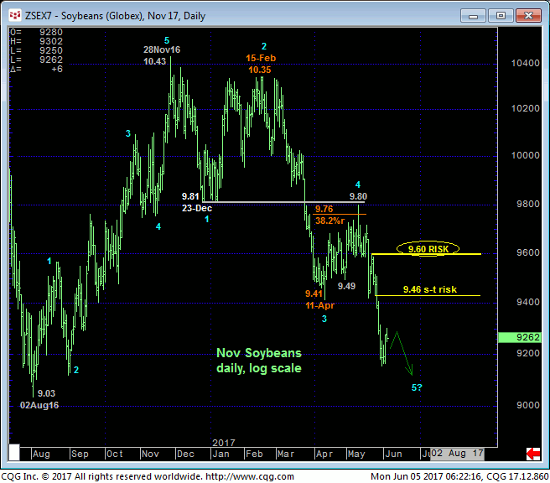
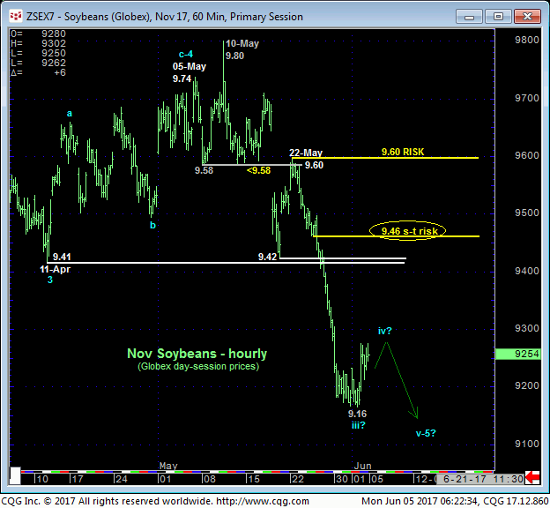
The technical construct and expectations for the Nov contract are virtually identical to those detailed above for Jul with former 9.42-area support considered new key resistance ahead of further and possibly accelerated losses. IF the 5-year secular bear market is resuming to new lows below 8.44, then we don;t believe this market should come anywhere near that 9.42-area, let alone our short- and longer-term risk parameters at 9.46 and 9.60. And here too, if the market resumes the slide to new lows below last week’s 9.16 low as we strongly suspect, whatever high to the correction such a relapse will leave in its wake (9.28 currently) will become our new key shorter-term risk parameter to a still-advised bearish count.
In sum, a bearish policy remains advised with strength above 9.46 required to threaten this call and warrant defensive measures. In lieu of such strength we anticipate at least one more round of new lows below 9.16 and potentially sharp losses thereafter. But again, from a very long-term perspective, if this downtrend doesn’t STAY DOWN with each round of new lows, the combination of historically bearish sentiment and the market’s position in the lower-quarter of the past couple years’ range is a unique and compelling one from which a major BASE/reversal environment must be considered and that will likely shock the masses.
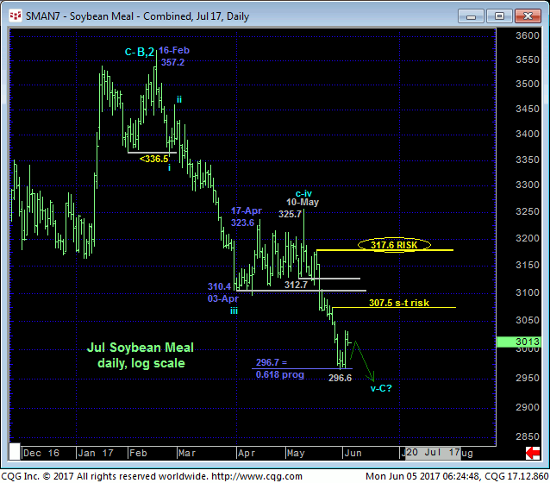
JUL SOYBEAN MEAL
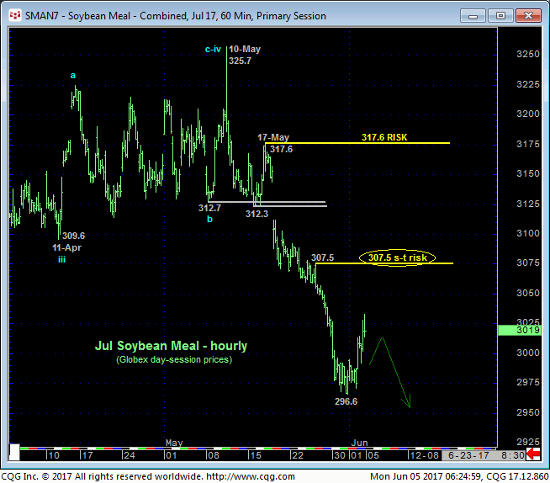
Against the backdrop of the broader downtrend so clear in the daily log scale chart below, the past few days’ rebound attempt is considered another corrective hiccup ahead of eventual resumed losses to another round of new lows for the move. A minor corrective high at 307.5 from 25-May is considered our new short-term risk parameter as this is the minimum level the market needs to recoup to jeopardize the impulsive integrity of a more immediate bearish count.
ON a broader scale former 310-to-312-area support serves as a hugely important new resistance candidate this market should EASILY sustain losses below per any broader bearish count. The market’s failure to do so will not only suggest the decline from 16-Feb’s 357 high is a complete 5-wave Elliott sequence as labeled in the daily log scale chart below, it will expose a base/reversal count that could be major in scope.
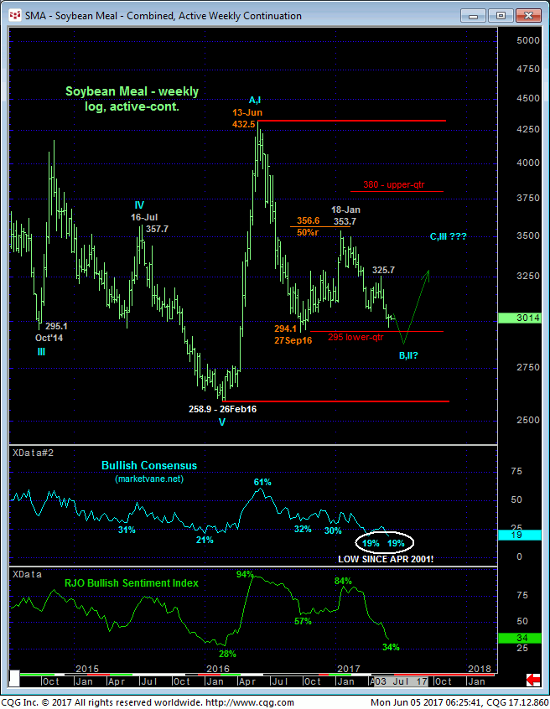
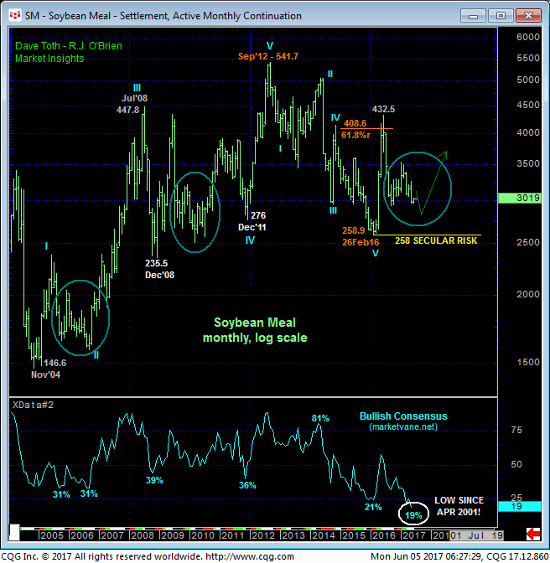
The weekly log scale active-continuation chart above shows the market’s encroachment on the (295) lower-quarter of the past couple years’ range where, along with a not unexpected return to historically bearish sentiment levels, traders are urged to keep a keen eye on the market’s ability, or not, to SUSTAIN trendy, impulsive behavior lower. Indeed, the current 19% reading in the Bullish Consensus (marketvane.net) measure of market sentiment equals early-Apr’s level that is the lowest in 16 YEARS! Combined with the plunge to 34% in our RJO Bullish Sentiment Index, such historically bearish sentiment conditions are what we expected to occur on the market’s assault on the lower-quarter of such a broad range and within the context of a MAJOR BASE/reversal threat from Feb’16’s 258.9 low.
If there’s a time and place for this market to sock the huddled bearish masses with a major reversal higher, it is from this lower-quarter, BUT ONLY AFTER a confirmed bullish divergence in momentum stems the clear and present downtrend. Herein lies the major importance of corrective highs like 307 and especially 17-May’s 317.6 next larger-degree corrective high and key long-term risk parameter that, if recouped, we believe will reinforce a major base/reversal environment similar to those from 2010 and 2006 circled in blue in the monthly log scale chart below.
With the next key crop report not due out until 30-Jun, we don’t expect any great technical revelations prior to the end of the month. HOWEVER, this market has the next four weeks to “make that preparatory bed”. IF that report presents THE obvious reason why this market will be headed back up, the base/reversal PROCESS that includes a bullish divergence in momentum will unfold before it and provide traders an ample and objective opportunity to position accordingly. In sum a bearish policy remains advised for the time being with a recovery above 307.5 minimally required to threaten this call and warrant defensive measures. In lieu of such strength further and possibly accelerated losses should not surprise.
