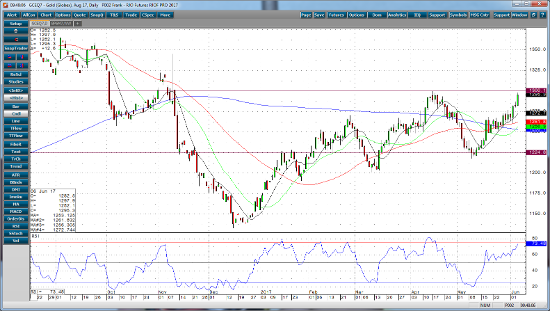
It’s almost always just a level on a chart that stops or reverses a market’s short term trend. August gold futures are currently testing the $1,300 level. This level is decent resistance on a daily and weekly chart, but more importantly, $1,300 level erases the entire correction that lasted four weeks and went from $1,300.3 on April 17 to $1,217.8 on May 9. This $1,300 level is also a big psychological level. Markets like round numbers and gold in particular likes $25 increments. Just look at a daily chart.
The rebound in gold has been driven by US Dollar weakness, geo-politics, and a general uncertainty in the strength of the global economic recovery. It’s not possible to predict geo-politics or Washington politics, what James Comey will say, or how the UK election is going to turn out. Therefore, the uncertainty isn’t likely to just go away. That being said, we head back to the charts. If I were a betting man I would say that this market has likely run its course for now. I would expect some profit taking in this area between $1,295 and $1,300. If August gold futures manage to close above the $1,300 level, then I would look for a run to test $1,325. It’s going to take a steady diet of “new” bullish news to feed this rally and I just don’t see it right now. I would like to see a small correction in the market back towards the $1,260 range.
Aug ’17 Gold Daily Chart


