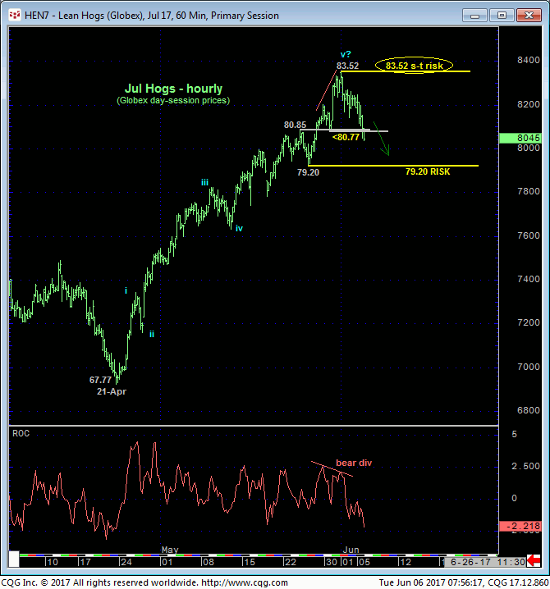
With the market’s failure yesterday afternoon below 30-May’s 80.77 minor corrective low and area of former resistance-turned-support, it confirmed a bearish divergence in short-term momentum that warns that Thur’s 83.52 high might have completed a 5-wave Elliott sequence from 21-Mar’s 67.77 low as labeled in the hourly chart below. This admittedly short-term mo failure defines last week’s 83.52 high as one of developing importance and a short-term risk parameter from which non-bullish decisions like long-covers and cautious bearish punts can now be objectively based and managed.


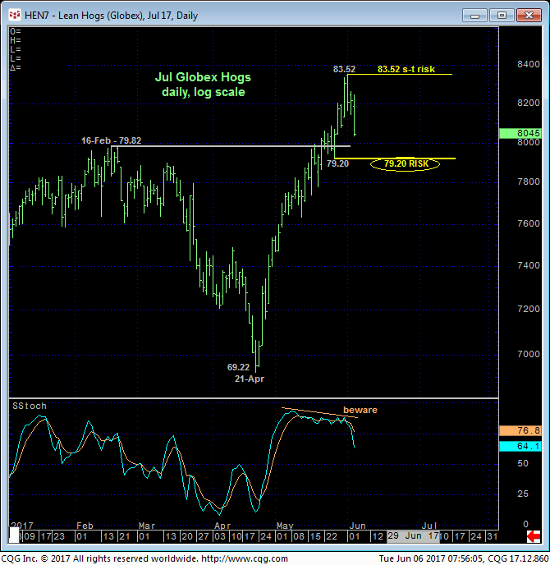
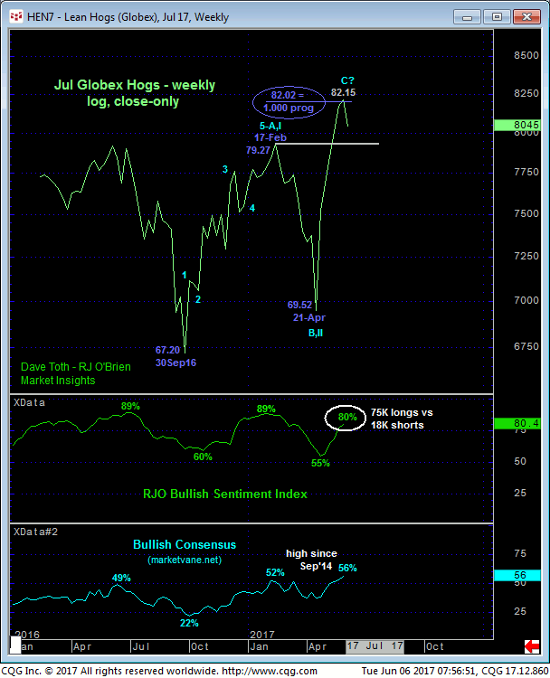
On a scale commensurate with Apr-May’s impressive rally a failure below 25-May’s next larger-degree corrective low at 79.20 remains required to confirm a bearish divergence in mo sufficient to conclude the rally from 21-Apr’s 69.22 low is complete. It is very interesting to note however that on a weekly log close-only basis below this rally was virtually identical in length (i.e. 1.000 progression) to Sep-Feb’s preceding 67.20 – 79.27 rally. This chart also shows that market sentiment levels exploded to historically frothy levels that have warned of and accompanied PEAK/reversal environments in the past.
“Picking tops”, especially one following such an extraordinary rally as this market has recently produced, is typically a lose-lose ordeal. As a result of the factual bearish divergence in short-term momentum however and along with ancillary peak/reversal-threat evidence in the form of a Fib progression relationship and return to historically frothy bullish sentiment, we believe the market has identified an acute peak/reversal-threat opportunity that can be safely navigated as long as last week’s 83.52 high remains intact as a short-term risk parameter from which any non-bullish decisions like long-covers and cautious bearish punts can now be objectively based and managed.
These issues considered, traders are advised to move to at least a neutral/sideline policy or cautious bearish position from the 80.85-area with a recovery above 83.52 required to negate this call and re-expose the major bull. In lieu of such 83.52+ strength and considering the extent of bullish sentiment, the market’s downside potential/vulnerability could be significant.

