DEC CORN
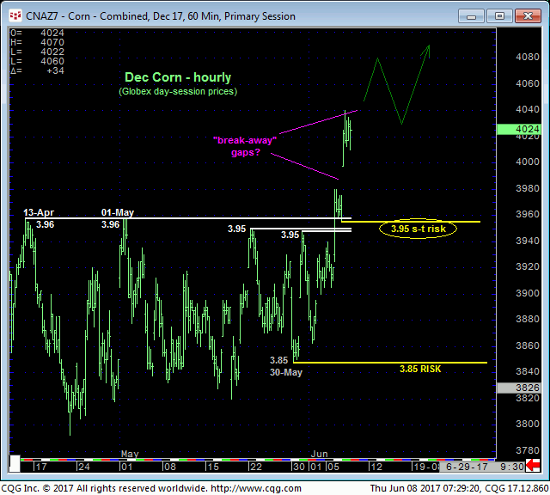
For weeks, if not months, corn wafted laterally in a rangey environment that included numerous “common” gaps that were mainly closed in the simple course of lateral, choppy trading. Much fewer and farther between are “break-away” gaps that are found in also-less-frequent major trends. These gaps often times remain open despite the consensus opinion that “all gaps get closed”.
Over the past three days (including today) the market has obliterated the 3.95/3.96 upper boundary of a 2-MONTH range and, with today’s second gap-up open in as many days, 2017’s 16-Feb 4.04 high. This market has not only reinstated the 9-month uptrend from 31Aug16’s 3.58 low, but also produced gap-up openings the past two days that could be “break-away” gaps that may NOT be closed ahead of further and possibly steep, even relentless gains.
Under this week’s sharp rally circumstances we are considering Tue afternoon’s 3.95 corrective low as the latest smaller-degree corrective low that now serves as our new short-term risk parameter to a bullish policy. Setback attempts are advised to first be approached as corrective buying opportunities with former 3.95-area resistance a huge new support candidate.
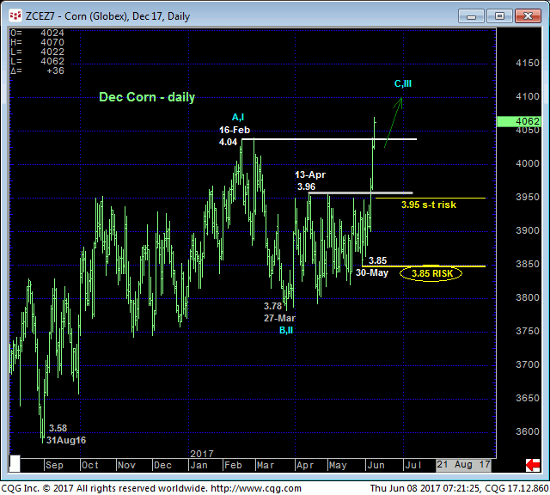
There’s not a lot that can be said about the daily chart above. By breaking above the both the Apr and Feb highs at 3.96 and 4.04, respectively, the market has confirmed the long-term trend as up and defined smaller- and larger-degree corrective lows at 3.95 and 3.85 as THE levels it now needs to fail below to threaten and then negate a broader bullish count that could shock the masses.
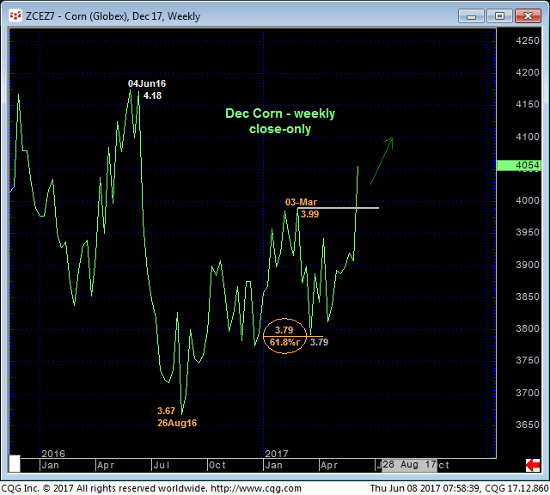
The weekly log close-only chart below shows NO levels of any technical merit between spot and Jun’16’s 4.18 high. This doesn’t mean we’re forecasting a move to 4.18, but it certainly does mean that until and unless the market weakens below a prior corrective low its upside potential is indeterminable and potentially severe, including a run at 4.18 or even above that level. Former 3.99-to-3.95-area resistance should easily hold as new support per any broader bullish count.
JUL CORN
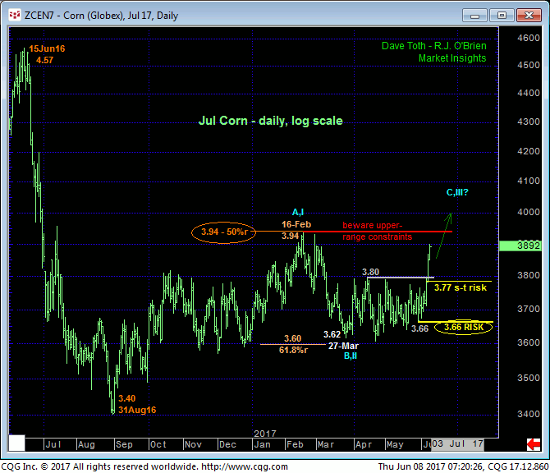
The daily log scale chart of the Jul contract above shows that it has yet to break its 16-Feb high at 3.94. We’re not sure how much this matters however following the past couple days’ break above the past couple months’ 3.80-area resistance. Corrective lows have been identified at 3.77 and 3.66 and until the market proves weakness below at least 3.77, the trend is up on all practical scales and should not surprise by its continuance.
On a weekly log active-continuation chart basis below, that is currently reflecting Jul contract prices, the market has broken out above 28-Feb’s 3.87 high in the then-prompt May contract. Here too the market has exposed a giant area totally devoid of any technical levels of merit between that former 3.87-area resistance and Jun’16’s 4.39 high. The only levels that exist above the market are “derived” levels like channel lines, Bollinger Bands, perhaps a moving average and even the vaunted Fibonacci progression levels we use often in our analysis. And ALL of them are useless in the face of this clear and present uptrend in the absence of an accompanying confirmed bearish divergence in momentum needed to stop the bull. And such a mo failure requires proof of weakness below a prior corrective LOW.
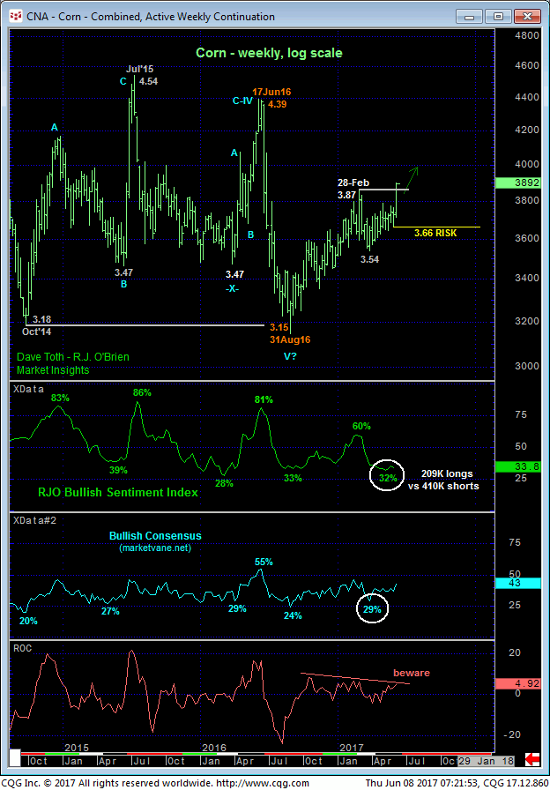
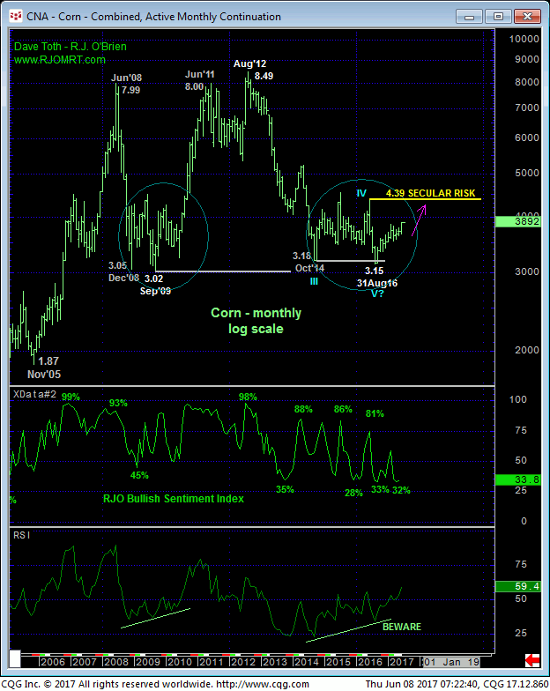
Finally and crucially important to the long-term base/reversal count introduced in 03Oct16’s Technical Blog, our proprietary RJO Bullish Sentiment Index of the hot Managed Money positions reportable to the CFTC remains at historically low, pessimistic levels TYPICAL of exactly such bullish conditions. At a mere 34% level reflecting 209K longs to a whopping 410K shorts, the huddled masses are once again caught short in a major bottoming environment. This happened last Aug’16, in Jun’15, Oct’14 and pretty much EVERY major bottom over the last 20 years.
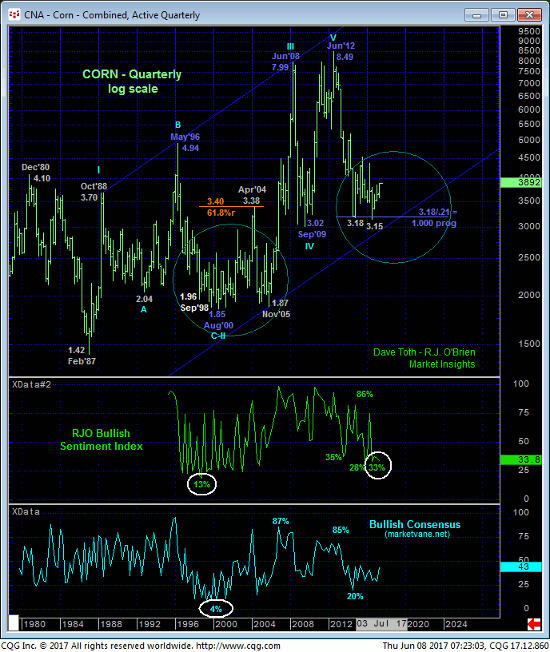
We maintain our long-term call that the price action from Aug’16’s low (and even Oct’14’s low) is the same that unfolded in the Dec’08 – Jun’10 period and the entire 1998 – 2005 period circled in blue in the monthly (above) and quarterly (below) log scale charts. Does this mean a move to $4.50? $5.00?? $6.00??? There is now way to tell. But we know EXACTLY what the Dec contract has to do to threaten or negate this count: fail below 3.95 and then 3.85. But we would strongly suggest that the extent to which the consensus has its neck sticking out on the bear side warns of a steeper, more relentless move higher than a muted one. A simple review/revisit of the 2010, 2006 and 2002 periods provides the best insight we can muster for what the market could have in store for us in the months ahead.
These issues considered, a new and aggressive bullish policy is urged with setback attempts to the 4.04- 4.00-range in the Dec contract advised to be approached as corrective buying opportunities and a minimum failure below 3.95 required to threaten this call and warrant paring or covering bullish exposure. In lieu of such weakness further and possibly severe gains are anticipated straight away and for what could be months or even quarters.
