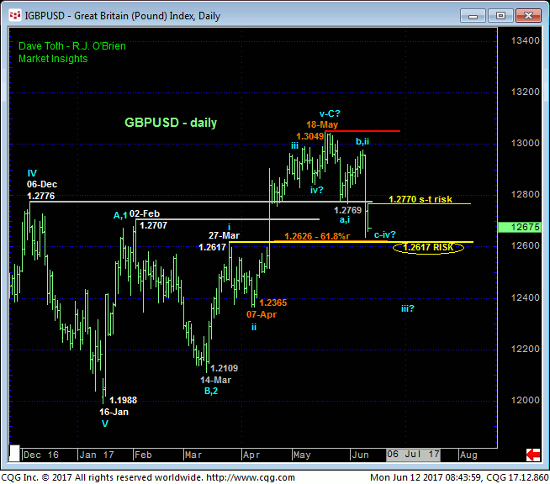
In recent updates we’ve highlighted 27-Mar’s 1.2617 (1st-Wave) high as the longer-term risk parameter the market needed to sustain gains above to maintain a more immediate and potentially major bull move. Perhaps more important than this single point, the entire 1.2600-to-1.2775-range that capped this market has major resistance from 06Dec16 until 18-Apr’s breakout has been considered a key new support candidate that is expected to hold if this market is truly strong and in the relatively early throes of a major correction or reversal of the secular bear.
Today’s resumed slight brings this key toggle point and long-term risk parameter into even sharper focus, the failure below which could render Jan-May’s entire 1.1988 – 1.3049 recovery a 3-wave and thus corrective affair as labeled in the daily chart below and re-expose the secular bear to new lows below 1.1988.
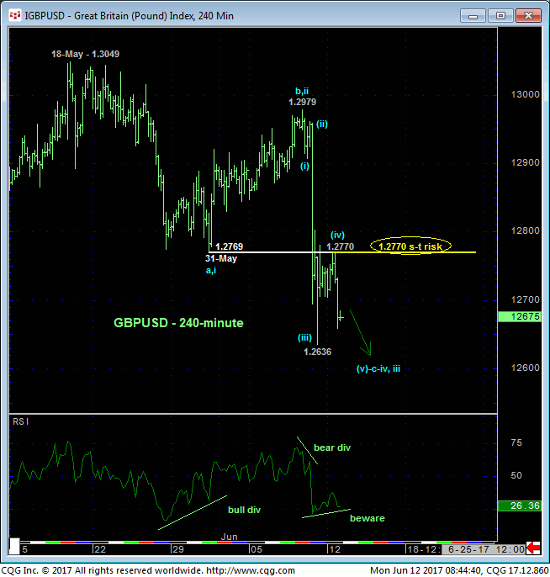
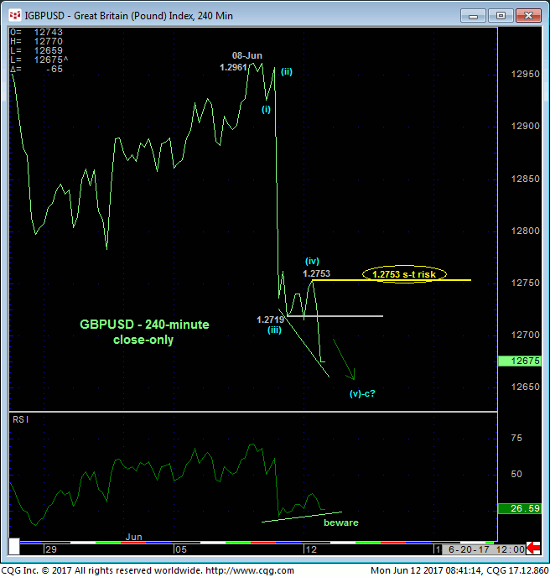
While the 240-min bar chart above shows that the market has yet to break Fri’s 1.2636 intra-day low, for all intents and purposes Fri morning and overnight’s recovery attempt is considered a correction within at least an intermediate-term downtrend that has identified today’s 1.2770 high as the END of that corrective and the minimum level this market is now required to recoup to not only stem the intermediate-term slide, but also to possibly resurrect a longer-term bullish count. In effect we believe the market has identified 1.2770 and 1.2600 as the key directional triggers heading forward. A break beyond either of these levels could expose a major move.
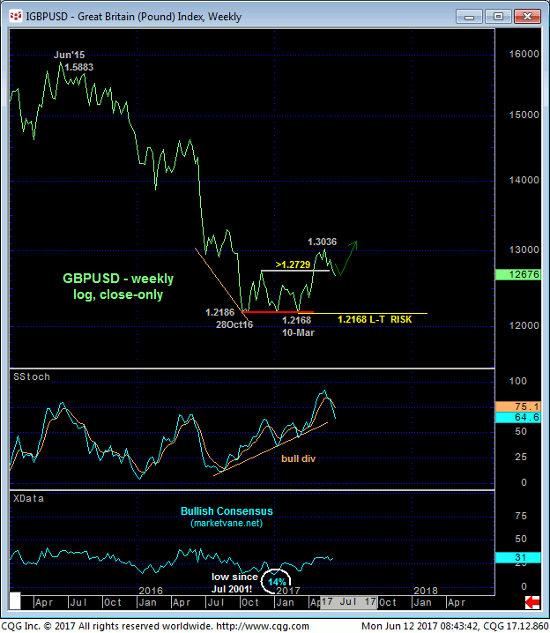
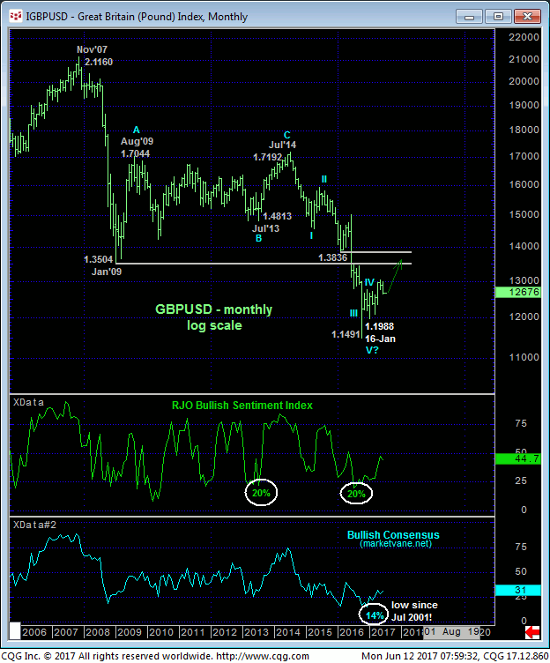
We have discussed the prospect for a major base/reversal environment resulting from mid-Apr’s rally. Clearly however, the extent of Jan-May’s entire recovery still pales in comparison to the secular bear trend from even Jul’14’s 1.7192 high, let alone Nov’07’s 2.1160 high shown in the monthly log chart below. The recovery attempt from 16-Jan’s 1.1988 low to 18-May’s 1.3049 high falls well within the bounds of a mere corrective hiccup on this massive scale and re-expose that bear on a failure below 1.2600.
These issues considered, a cautious bearish policy is OK for shorter-term traders with tighter risk profiles from current 1.2660-area prices with a recovery above 1.2770 required to negate this call and resurrect a broader bullish count. Longer-term players remain OK to maintain a cautious bullish policy, but a failure below 1.2617 poses a dire threat to this call that at least warrants its immediate cover, if not a new cautious bearish position with a recovery above 1.2770 required to negate that call. In effect traders are advised to toggle directional biases and exposure around the 1.2617 – 1.2770-range.
