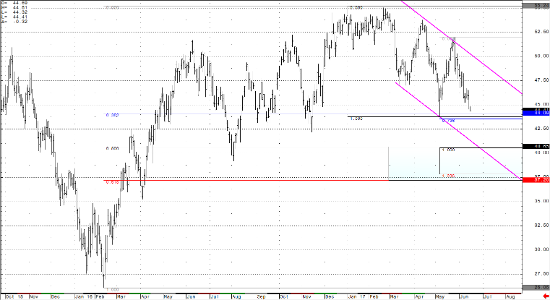
WTI crude oil futures are trading lower on the day for the July contract as we come to the final weeks of its lifecycle. With the roll into the August contract in swing, the lows in price made in the month of May are quickly coming into question for oil as bears maintain firm control of this market. The July low for May came in at 44.13, while the August contract low for May was made at 44.45. Both of those contracts are closing in and testing this prior support, and below opens the door on the continuous contract to a test of the 40.00 handle (as seen below). From the perspective of the larger time frames, it’s clear that crude oil is still in a range while below 60 and above 40, however, while inside this range there is plenty of room for this market to stretch its legs.
Qatar has quickly replaced OPEC in the headlines, which were constantly reiterating rhetoric for continued production cuts and their attempts to support this market with talk is proving too cheap. Qatar and other destabilizing occurrences in the region run the risk of OPEC losing its foothold, and more importantly, losing control of global oil supplies (giving that control back to western producers). This week’s EIA inventory report saw a 1.7 million barrel draw, compared to last week’s report of a 3.3 million barrel build. This was generally in line with expectations, and the recent decline in the price of oil is likely due to the breakdown in OPEC’s member nation’s agreements on Qatar. While inside these levels, expect to see a fight over trend and continued range bound price action.
From a technical perspective, July crude futures are still very much under the firm control of the bears. Within hours, I expect WTI crude to take out its May lows (the 2017 lows as well) and test towards the lows of 2016. There, crude should fine a support level where there is a confluence of Fibonacci support bands (retracements and extensions) between 40.65 and 37.20 (daily continuous chart below). There is also a declining price channel, formed from the trend line against the 53.76 and 52.00 highs, and the trend line against the 47.09 and 43.76 lows. I expect the extension of this trend line support, which crosses the 50% Fibonacci retracement and 100% Fibonacci extension at the 40.65 area, to be tested and support the market in the near to medium term. The bears have possession at this time, and it’s their ball to fumble.
Continuous Crude Light Daily Chart


