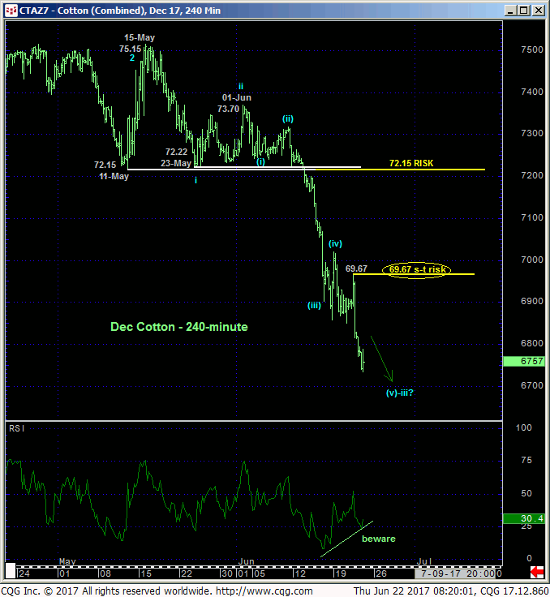
Yesterday’s continuation of Jun’s total meltdown leaves yesterday’s 69.67 high in its wake as the latest smaller-degree corrective high this market is now minimally required to recoup to threaten the bear and expose even an interim corrective rebound. In this regard that 69.67 high serves as our new short-term risk parameter for a still-advised bearish policy for shorter-term traders with tighter risk profiles.


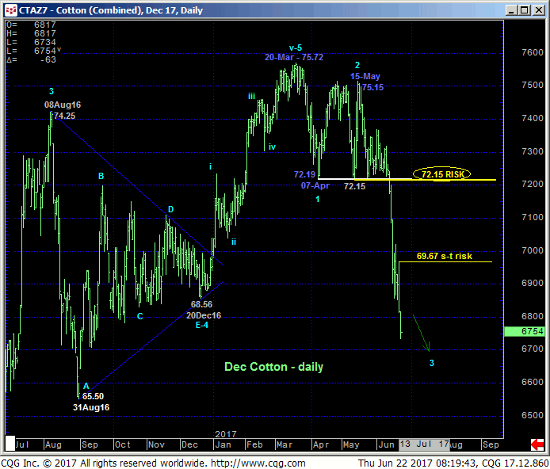
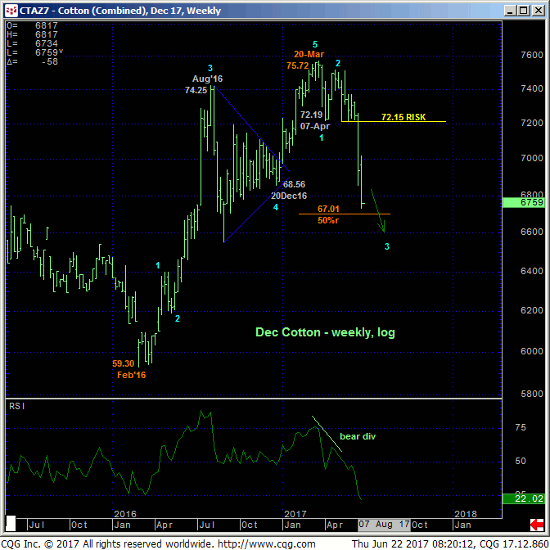
Clearly, the 2016-17 uptrend has been broken in a major way and exposes AT LEAST a major correction of that entire bull trend and possibly its entire reversal. The market’s downside potential is approached as indeterminable and potentially severe with ALL pertinent technical levels currently only existing ABOVE the market in the form of either prior corrective highs like 69.67 and former support-turned resistance like the 72.15-area shown in both the daily chart above and weekly log scale chart of the Dec contract below. We have noted the (67.01) 50% retrace of the 2016-17 rally from 59.30 to 75.72, but this merely derived level means nothing in the absence of a confirmed bullish divergence in momentum that requires a recovery above at least 69.67.

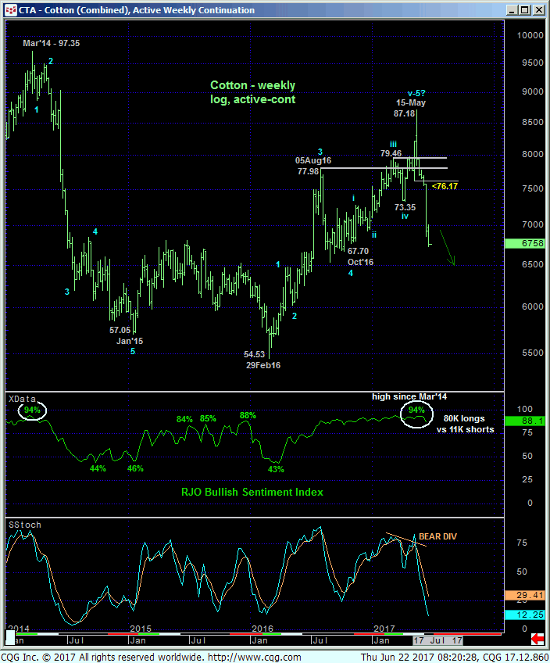
The weekly log active-continuation chart below shows still-frothy bullish exposure by the Managed Money community indicated by our proprietary RJO Bullish Sentiment Index. There’s little doubt that, as expected, the past couple weeks’ total meltdown was the result of the market forcing the capitulation of this gross long-&-wrong exposure. And while the RJO BSI is likely to fall sharply in coming weekly updates, it has done its job of warning of a reversal lower that could be major in scope. Navigating an interim bottom or base/reversal threat is now the job of momentum. And until or unless the market recoups a prior corrective high, further and possibly extreme losses remain expected.
In sum, a bearish policy remains advised with minimum strength above 69.67 required to pare of cover bearish exposure. The markets downside potential remains indeterminable and potentially severe.


