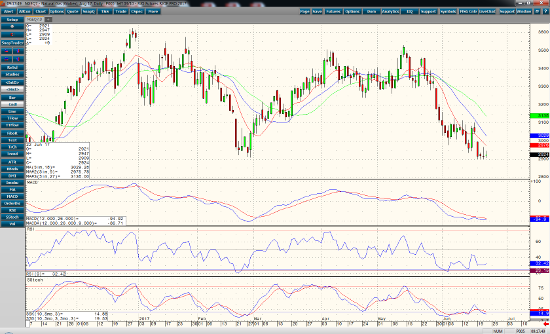
The trend in August natural gas is down. Support is at 2.900 with a triple bottom at or near that price on a daily chart. A close below the support lows could signal sell offs below 2.83 to the 2.75 mark. Any corrections in the current down trend will find it hard to fill the gap and go from Monday’s trade. It will require a close above 3.00-3.02 levels to negate the current trend.
Momentum indicators are at oversold levels, and are showing no signs of divergence on a daily chart. Today’s storage numbers are an expected 55 bcf infusion. Although this less than the 5-year average of 86 bcf, storage is almost 10% above the 5-year average at over 2700 bcf. Less than the expected infusion may of 55 bcf may cause a bounce in prices.
Below normal temps are giving way to weather forecasts calling for a minor heat wave which could support prices. Tropical Storm Cindy hasn’t caused any shut downs in the gulf yet. I believe that exposure to the short side of the market may still be warranted.
Aug ’17 Natural Gas Daily Chart


