In the early morning trade, August gold is up roughly $8 and has rebounded nicely off this week’s low back on Wednesday of $1241.7. Yesterday, gold started off the rally in the face of adversity from the US dollar and positive stock market action. Furthermore, reports of one US fed member stating that the projected rate hikes are overly aggressive. Maybe this is a start of forward policies out of Washington that are set to temper a deflationary atmosphere, which should benefit gold to see higher prices.
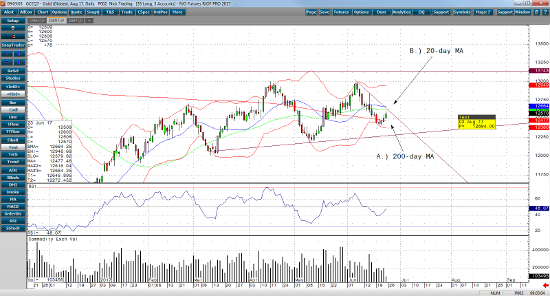
If we take a quick look at the daily August gold chart, you’ll clearly see that buyers came in once gold fell just below its 200-day moving average which currently rest at $1,247.7. However, it still trades below its 20 and 50-day moving averages, which gold will have to get and stay above in order to get back to $1,300.0 an ounce. If gold can get back above $1,266.0 an ounce, then we could see some momentum buying up to $1,300 an ounce. Below is a daily August gold chart with the technical levels above.
Aug ’17 Gold Daily Chart


