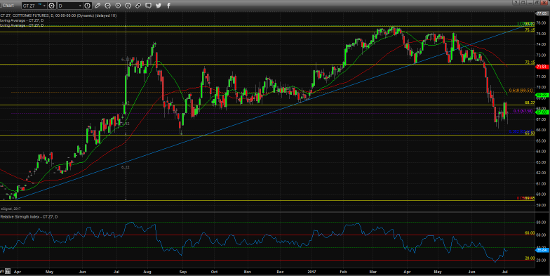
The recent USDA Acreage report pegs 2017 cotton planted area at an estimated 12.1 million acres, up roughly 20% year over year. Interestingly enough, cotton prices for the December contract saw a decent upside move immediately following the report, which leads some traders to believe that the 20% increase was largely priced into the market. Following the temporary pop in price action, cotton made a sharp correction and closes today’s trading day largely in neutral territory. Curious that the 50% Fibonacci retracement of the previous run up in prices (from approx. April ’16 – April ’17) comes in right around 67.58, which is where current price action finds itself oscillating around.
A technical band of structure can be seen from roughly 68.37 – 68.70, which takes into account the recent peak following Friday’s report. Look to this area as the initial upside resistance area with 65.50 – 65.70 serving as near-term technical support on the downside. Price action was resoundingly weak throughout June as participants began looking forward to the new crop prospects. How much of the 20% increase in acreage is priced into the market remains to be seen; however, it does appear that cotton is attracting some renewed buying interest down at these levels. In the event that the near-term negative momentum continue to weigh in on prices, look to the 65.50 – 65.70 as the next level of potential support in the cotton market.
Dec ’17 Cotton Daily Chart


