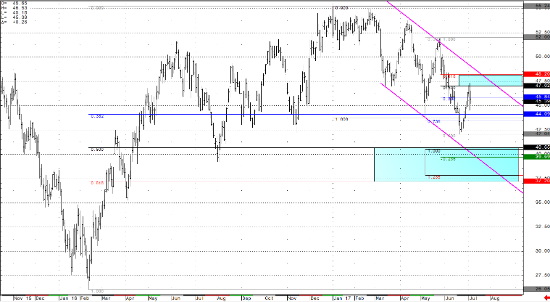
WTI crude oil futures have held above the 45.00 price handle in Thursday’s trading, and likely now being supported by a stunning EIA petroleum status report that is considered bullish for the trade. This week’s EIA report estimated a 6.3 million barrel draw on inventories, and price action began to rally off the 42.05 July lows yesterday to highs testing 47.32 to start the week. While prices remain above the 45.00 line in the sand I noted in last week’s article, it becomes increasingly unlikely there will be a move lower towards a test of the 40.50 Fibonacci and technical confluence area in the continuous daily contract.
As I have said before, talk is cheap, and while OPEC cuts have been made a reality, it’s clearly not enough of a consensus to empower the bulls. The continued talk and production of US shale has been out pacing the OPEC efforts to cut production, at least in the minds of traders and the market. The recent rally off the 42.00 level appears to be more profit taking than longs initiating long term positions, and it’s possible that there will be more participation from lower prices. Support today above 45.00 handle also helps aide this consensus, and seasonal calendar spreads suggest there may be a tightening in supply and increased demand for crude in the near term.
From a technical perspective, breaking below the May 43.76 lows from the continuous contract is massively significant from last week. I discussed last week the same set of technical indicators that are driving the market lower, including two Fibonacci measurements, the lows from July of last year, and the channel the market has been holding the last 4 months. In the near term, look out for the 44.00 support from equal legs and 50% fibs on the smaller time-frame charts. Resistance for this week is expected into channel and Fibonacci confluence zone from 47.00 to 48.20. If the market continues to break down below 45.00 then below the lows of July at 41.05 for the August contract, WTI crude futures should find a support level where there is a confluence of Fibonacci support bands (retracements and extensions) between 40.65 and 37.20 (daily continuous chart below). I expect the extension of this trend line support, which crosses the 50% Fibonacci retracement and 100% Fibonacci extension at the 40.65 area, to be tested and support the market in the near to medium term. Now that the market is above the 45.00 area, this opens the door for a test to channel resistance into the 47.20’s to 48.20’s. The only question we have to answer with crude: will it come back down?
Crude Light Daily Continuation Chart


