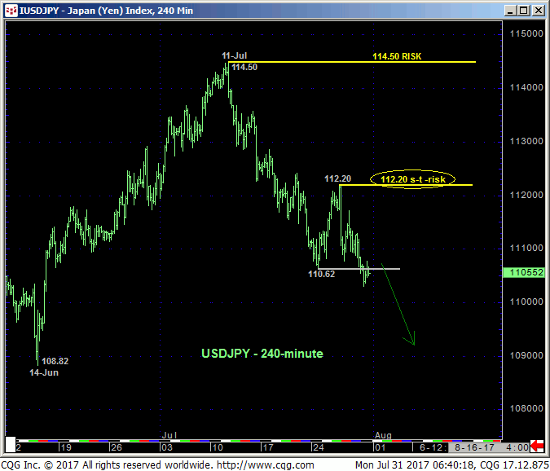
For the past couple months we’ve been kind of hands-off this market because of the prospects of aimless, whipsaw-type behavior typical of the middle-halves of lateral ranges. But for longer-term sentiment reasons we’ll discuss below and because of a new and tighter short-term risk parameter resulting from Fri’s break below 24-Jul’s 110.62 low detailed in the 240-min chart below, we believe this market is now presenting a favorable risk/reward opportunity from the bear side.
Indeed and as a direct result of Fri’s resumed intermediate-term downtrend, the market has identified 26-Jul’s 112.20 high as the latest smaller-degree corrective high this market now much recoup to break the past three weeks’ slide and expose another intra-range whipsaw higher. In lieu of such 112.20+ strength further and possibly surprising losses are now expected. Per such 112.20 is considered our new short-term risk parameter to a cautious bearish policy. Former upper-110-handle-area support is considered new near-term resistance ahead of further losses straight away.


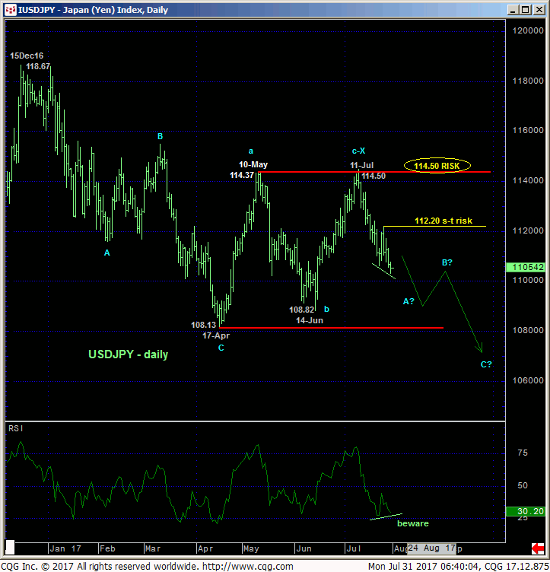
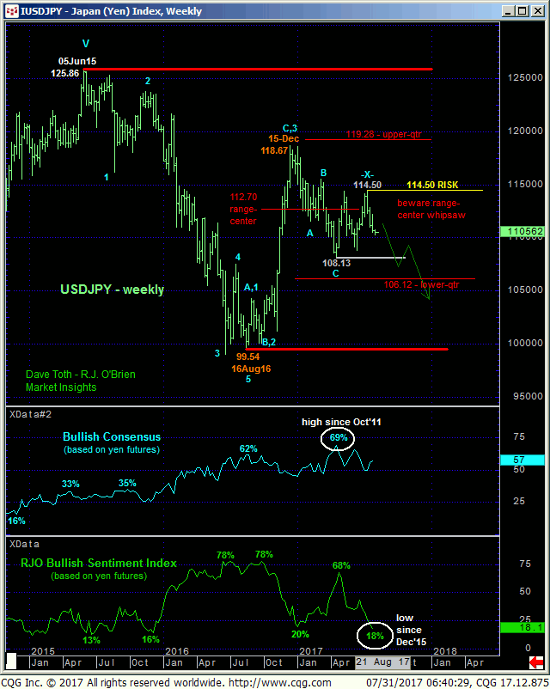
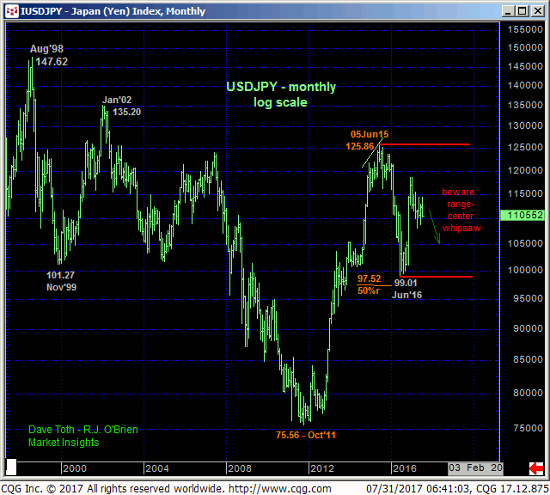
The daily chart above shows the market still constrained within the middle-half bowels of the past four months’ range that remains deep, deep within the middle-half of the past TWO YEAR range shown in the weekly chart below. The POTENTIAL for a bullish divergence in momentum is clear in the daily chart, but only proof of strength above 112.20 will CONFIRM this divergence to the point of non-bearish action like short-covers. So while we still want to acknowledge and respect the odds of continued aimless whipsaw risk typical of such range-center conditions, strength above at least 112.20 can now be objectively required to reaffirm this condition.
What’s also clear in both of these charts is 3-wave recovery attempt from 17-Apr’s 108.13 low. Left unaltered by a recovery above 11-Jul’s 114.50 high, this 3-wave recovery is considered a corrective/consolidative structure that warns of a resumption of Dec-Apr’s downtrend that preceded it. In this regard we’re identifying that 114.50 high our new long-term risk parameter to a bearish policy.
A contributing factor to a bearish tilt from current range-center conditions has been the deterioration in our RJO Bullish Sentiment Index of the hot Managed Money positions reportable to the CFTC. At a current 18% reading reflecting just 24K longs to a whopping 109K shorts in the yen futures contract shown on our CFTC page, this indicator represents the most bearish stance against the yen since Dec’15 that warned of and accompanied a major peak/reversal environment in the USDJPY. This fuel for downside vulnerability in the USD is once again in ample supply and warns of potentially surprising USD losses until threatened by a recovery above at least 112.20 and preferably 114.50.

These issues considered, traders are advised to move to a cautious bearish policy and exposure from the current 110.60-area OB with a recovery above 112.20 required to defer or threaten this call enough to warrant returning to a neutral/sideline position. In lieu of such 112.20+ strength, further and possibly accelerated losses should not surprise.


