NOV SOYBEANS
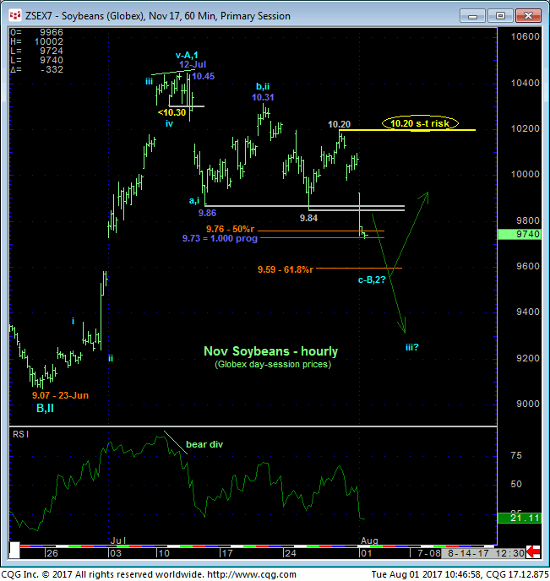
Today’s clear break below the past couple weeks’ 9.86/9.84-area support reaffirms the suspected correction to Jun-Jul’s rally discussed in 13-Jul’s Technical Webcast after 12-Jul’s mo failure below 10.30. The important take-away from this resumed weakness is the market’s definition of Fri’s 10.20 high as the latest smaller-degree corrective high the market now needs to sustain losses below to maintain a more immediate and potentially more extensive bearish count. Its failure to do so will render the sell-off attempt from 12-Jul’s 10.45 high the 3-wave and thus corrective affair we suspect it is. In lieu of such 10.20+ strength however further and possibly accelerated losses should not surprise with former 9.86-area support considered new near-term resistance.
In the hourly chart below we’ve also noted the 50% and 61.8% retraces of Jun-Jul’s 9.07 – 10.45 rally at 9.76 and 9.59, respectively, as well as the (9.73) 1.000 progression of the initial 10.45-to-9.86 decline from 20-Jul’s 10.31 corrective high. IF our long-term bullish count is correct, then we would expect the market to stem the clear and present intermediate-term downtrend with a confirmed bullish divergence in momentum somewhere in this area. As we NEVER RELY on such merely derived technical levels as a reason to buck a trend however, traders are urged NOT to consider any bullish exposure until and unless the market counters the current slide with a confirmed bullish divergence in mo. Herein lies the importance of identifying a tight but objective risk parameter like Fri’s 10.20 corrective high.
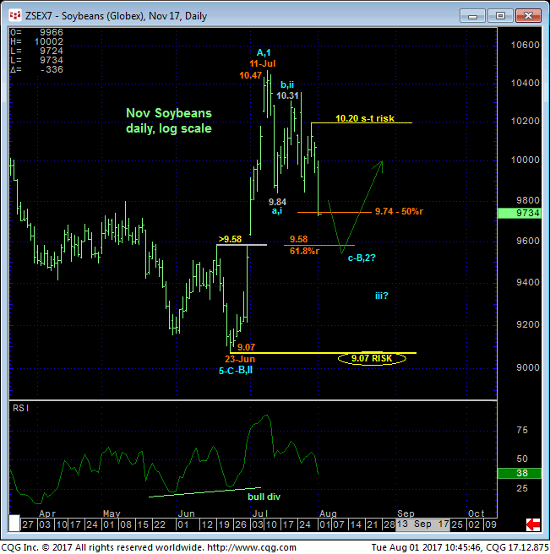
The extent and uninterrupted nature of Jun-Jul’s rally leaves virtually nothing in the way of former battlegrounds that can now be looked to as support candidates now that the market has clearly broken the 9.84-area. And even though the past three weeks’ setback still falls well within the bounds of a mere correction within a MAJOR BASE/reversal environment, further “correction” could span another 40- or 50-cents. The alternate bearish prospect that our preferred long-term bullish count is just flat out wrong ahead of a run to new lows below 9.07 is certainly a reason not to consider a bullish policy until the market stems the slide with a confirmed bullish divergence in momentum.
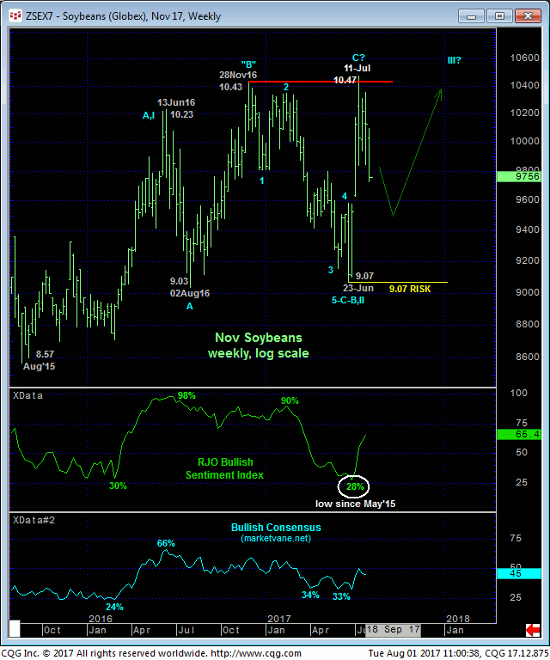
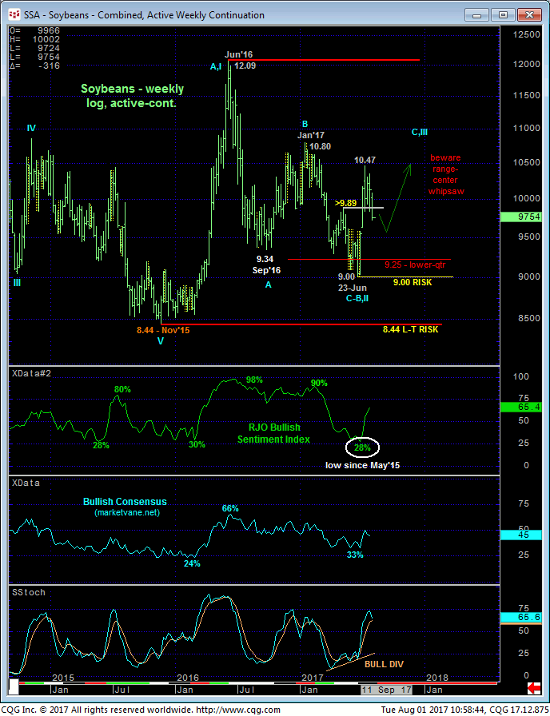
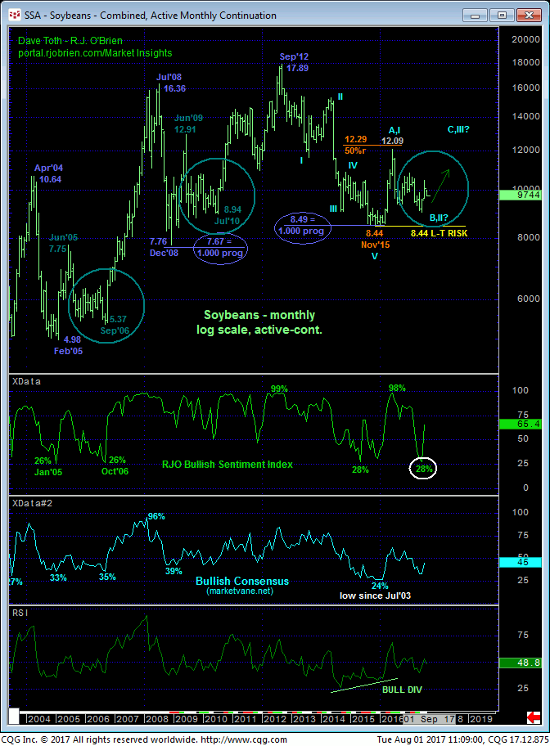
So what about our “preferred long-term bullish count”? Where’s THAT coming from? Below we once again list the technical facts that we believe define Nov’15’s 8.44 low as THE END of the secular bear market from 2012’s 17.89 all-time high and start of a new major correction or reversal higher:
- confirmed bullish divergence MONTHLY momentum (below) that breaks the secular downtrend
- historically bearish sentiment not seen since 2003
- a complete 5-wave Elliott sequence from 2012 to 2015
- the (astounding) Fibonacci fact that the entire 2012 – 2015 bear was identical in length (i.e. 1.000 progression) to BOTH the 2008 AND 2004-05 bear markets.
These facts warn of a major base/reversal PROCESS similar to the ones from Dec’08-to-Jul’10 and Feb’05-to-Sep’06 before the market rallied in major 3rd-waves where fundamentals reasons for the rally finally became clear and joined the strong technical forces. To negate this long-term bullish count all the market needs to do is break Nov’15’s 8.44 low.
When the bear had the opportunity to prove itself following Jun’s break below Sep’16’s 9.34 low and engagement of the lower-quarter of the 2-year range, it not only failed miserably to do so, the COMBINATION of this momentum failure and the gross extent to which the huddled masses flooded to the bear side provided the unique but typical technical conditions for a major bottom. 23-Jun’s 9.07 low in the Nov contract and 9.00 low basis the prompt month define these levels as interim ones the bear MINIMALLY needs to break to threaten our broader bullish count and re-expose the secular downtrend. In lieu of such sub-9.07 weakness then, it’s not hard to see why we believe it will be so important to see if the market stems the current slide with a bullish divergence in momentum somewhere around the 9.70-to-9.58-range. The ultimate payout to such could be a resumption of this major, multi-year base/reversal process to new highs above 10.50, and possibly well above that threshold.
These issues considered, a neutral-to-cautiously-bearish policy is OK from the 9.85-area OB with a recovery above 10.20 required to not only negate this call but warrant a move to a resumed bullish policy ahead of what could be extensive gains. In lieu of such 10.20+ strength further and possibly accelerated losses should not surprise. We will keep a close watch on shorter-term momentum from the 9.70-to-9.58-range where a confirmed bullish divergence could present an outstanding risk/reward opportunity from the bull side.
DEC SOYBEAN MEAL
The technical construct and expectations for meal are virtually identical to those detailed above for beans, from a shorter-term perspective all the way out to a multi-year base/reversal-threat count. Today’s resumed break defines Fri’s 331.9 high as the latest shorter-term corrective high and THE KEY short-term risk parameter the market needs to sustain losses below to maintain a more immediate bearish count and possibly negate our long-term bullish count. Former 325-area support is considered new near-term resistance.
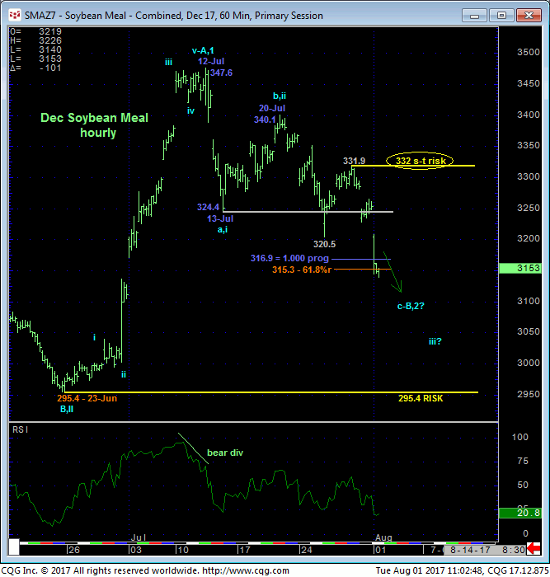
On both an hourly scale above and daily close-only basis below, the 317-to-315-area contains the pertinent Fibonacci retracement and progression relationships we’d suspect to see a bullish divergence in momentum around to suggest the past couple weeks’ sell-off attempt is a corrective buying opportunity. In lieu of such a countering mo failure we’re not going to argue with a clear and present intermediate-term downtrend.
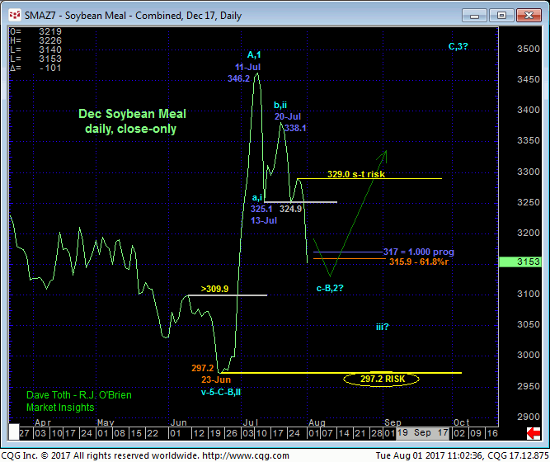
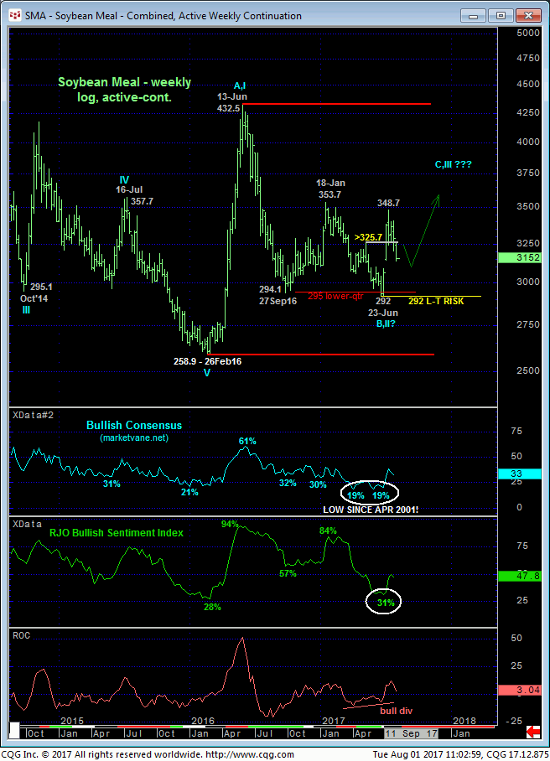
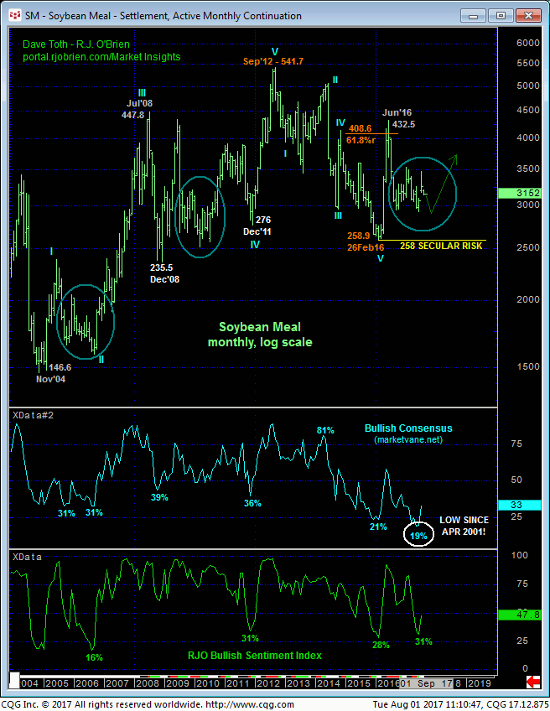
Only a glance at the weekly (above) and monthly (below) log scale charts is needed to see that this market’s long-term technical construct is identical to that discussed in beans. Over the next couple weeks we believe the matter is going to boil down to whether the market arrests the intermediate-term slide above 23-Jun’s obviously pivotal 295 low and key risk parameter with a momentum failure OR impulsively continue south and ultimately break 295. Currently the market is sitting pretty much in the middle of these two key directional triggers at 332 and 295.
In sum, a cautious bearish policy is OK from the 325-area OB with a recovery above 332 required to negate this call and reinforce a major bullish count. In lieu of such 332+ strength further and possibly accelerated losses won’t surprise.
