It’s been five weeks of straight crude inventory draws, with Wednesdays EIA Petroleum status report estimated stockpiles had declined by 1.5 million barrels, keeping pace with the anticipated summer month demand. Gasoline inventories also saw a draw, increasing by 1.5 million barrels from last week’s report, to 2.5 million barrels. Crude being consumed by refiners to replenish the draws in gasoline stockpiles is to be expected, however seeing increases in gasoline consumption is the key leading indicator to continuing crude demand.
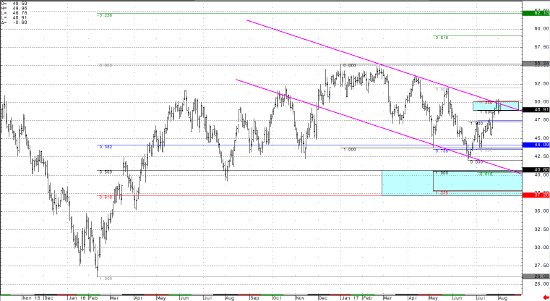
The same set of technical indicators that were diving the market price over the last couple weeks, including two Fibonacci measurements, the lows from July of last year, and the channel the market has been holding the last 4 months. The 44.00 support from equal legs and 50% fibs on the smaller timeframe charts, which I mentioned in last week’s article, is proving supportive and may be signaling the bulls are gaining back the ability to defend their ground. Now that front month crude prices have tested but are continuing to close below the 50.00 handle, the bears have a line in the sand to defend.
Resistance for this week is being tested into channel and Fibonacci confluence zone into the 49.00 to 50.00 handle. There is an equal legs measurement at 48.80 (which extends to the 123.6% line at 50.00), and this level aligns with channel trend line resistance. This short term line in the sand may keep the market under pressure in the near term, and the bulls will need to overtake 50.00 again to maintain short term control. Price has begun to pull back, and while still too early to call a reversal, a break down below 48.00 could confirm bears are back in control. In the medium to long term, WTI crude futures should find a support level where there is a confluence of Fibonacci support bands (retracements and extensions) between 40.65 and 37.20 (daily continuous chart below). In the near-term, the prior highs into 48.00 will be the next level of support to watch, followed by the prior lows of 42.05 for the September contract. The short term trend is up until it fails, but considering the massive draws to inventories, without crude above 50 handle the bulls aren’t out of hot water yet.
Crude Light Daily Continuous Chart


