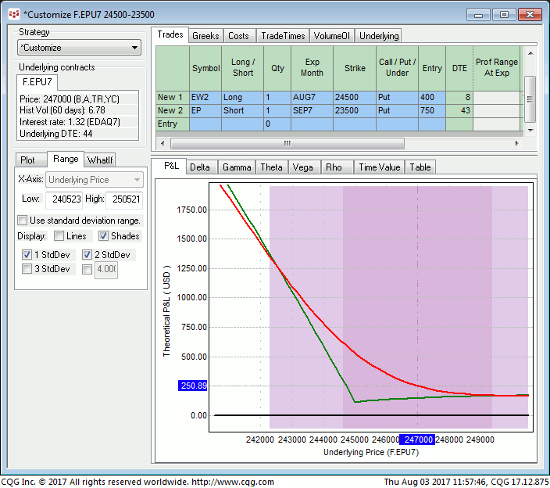
In 27-Jul’s Technical Blog we discussed that day’s bearish divergence in short-term momentum that defined its 2481 high as the prospective END to a 5-wave Elliott sequence up from 29-Jun’s 2402 low as labeled in the 240-min chart below. Thus far surviving a suspected (b- or 2nd-wave) corrective rebound attempt, the market may be even more poised for the more emotional (c- or 3rd-wave) stages of that correction in the period immediately ahead. And tomorrow’s Aug nonfarm payroll report may be just the fodder that juices it.
Per such an interim corrective count last week’s 2481 high remains intact as our short-term risk parameter the market needs to recoup to negate this call, reinstate the secular bull and expose potentially steep gains thereafter.
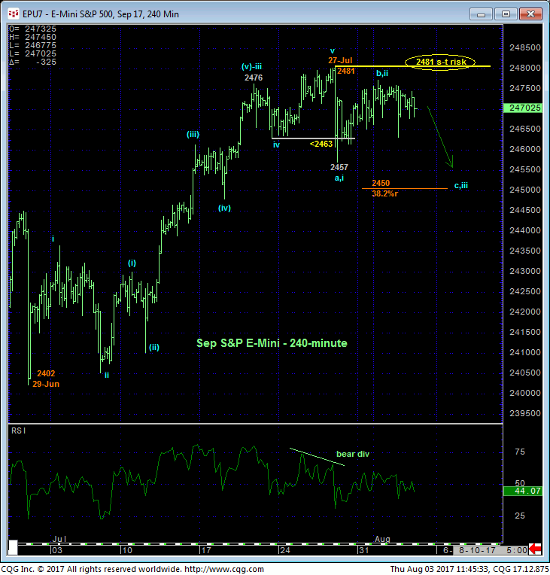
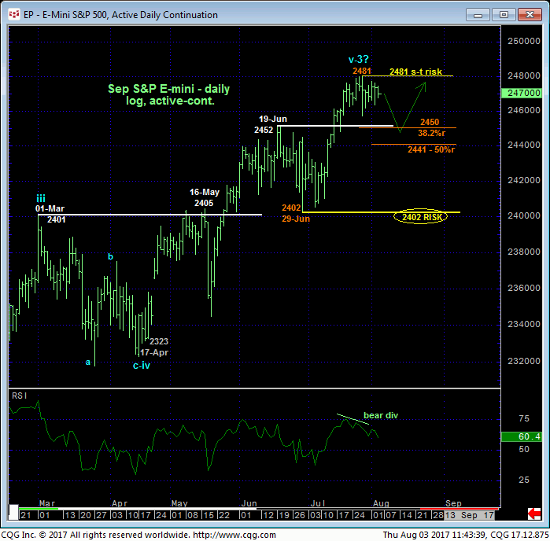
The daily log chart above and daily close-only chart below clearly show waning upside momentum that warns of another interim correction potentially similar to those that unfolded from 19-Jun’s high that spanned about 40-to-50 points and also the mid-May high. From this longer-term perspective however, such a setback would again be advised to first be approached as a corrective buying opportunity for longer-term players as commensurately larger-degree weakness below 29-Jun’s 2402 larger-degree corrective low and key risk parameter remains MINIMALLY required to even defer, let alone threaten the major uptrend.
In this long-term bullish regard former 2450-area resistance would be considered a new support candidate reinforced by the (2450) Fibonacci minimum 38.2% retrace of Jun-Jul’s 2402 – 2481-portion of the secular bull.
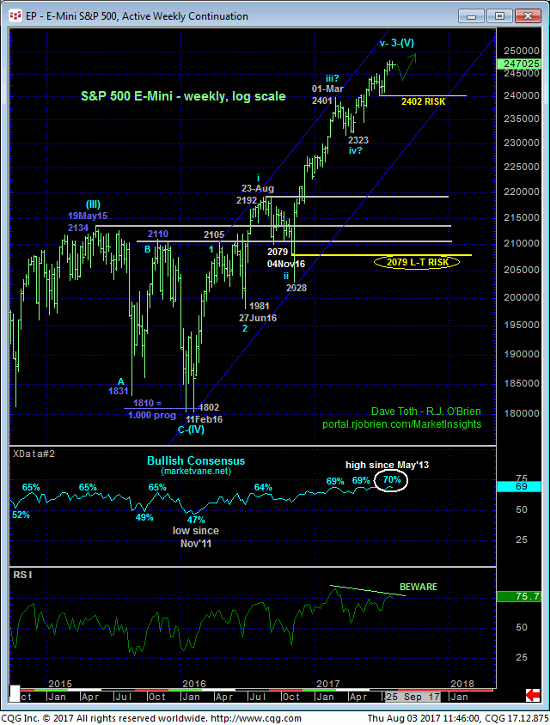
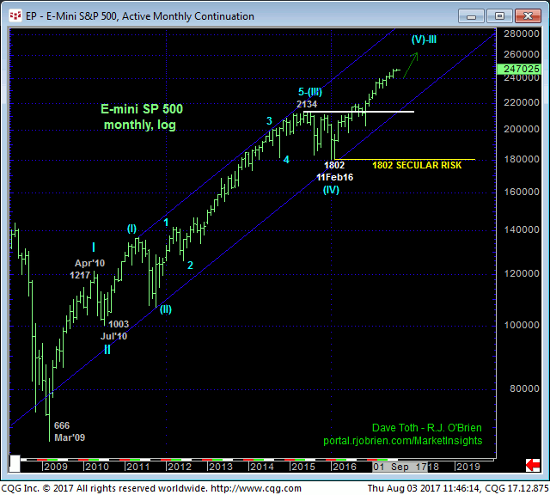
Indeed, the weekly (above) and monthly (below) log scale charts show the magnitude of the secular uptrend, an uptrend that could easily take weeks, if not month’s of lateral-to-lower price action before the threat to the long-term bull trend could be considered legitimate.
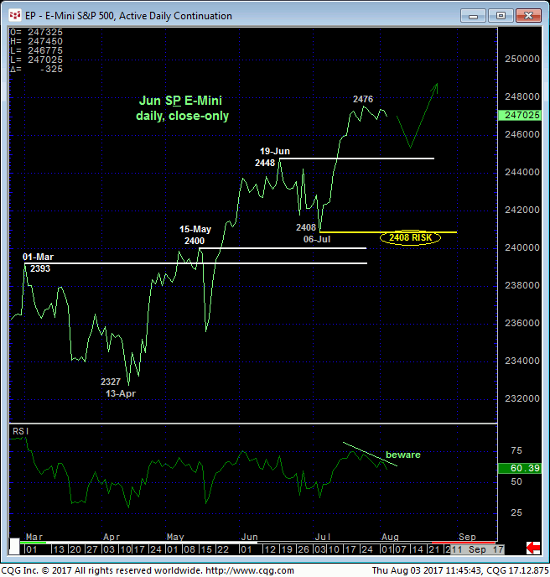
In sum, a bullish policy remains advised for long-term players with a failure below 2402 required to move to the sidelines. Shorter-term traders, on the other hand, are OK to maintain a cautious bearish policy and exposure from 2470 OB with a recovery above 2481 required to negate this call. Given the significant manner in which the key monthly nonfarm payroll can impact this market, we discuss below a favorable risk/reward bearish option strategy that traders can establish today and still get a good night sleep tonight even if the the secular bull trend resumes as a result of the key payroll report tomorrow morning at 7:30 CT.
The Aug Week-2 2450 / Sep 2350 Put Diagonal Spread involves buying 1-unit of the Aug Week-2 2450 puts around 4.00-pts and selling 1-unit of the Sep 2350 puts around 7.50-pts for a net credit of 3.50 points. This put diagonal strategy provides:
- a current net delta of -0.15
- whopping 10:1 gamma ratio
- negligible risk if the underlying Sep contract explodes higher
- significant profit potential on even an interim break to the 2450-area support support (let alone a more significant break below this area).
As always the biggest risk to such long-gamma strategies is simple market lethargy and boring lateral price action. Theoretically, this strategy has unlimited risk if 1) the long Aug Week-2 2450 puts expire worthless in eight days on 11-Aug’s expiration and 2) the trader doesn’t cover the then-naked Sep 2350 puts that could come back to haunt otherwise if the market simply delays a plunge. But such risk should NEVER come to fruition if this position is managed correctly as we’ll have a full week for the market to play its directional hand after tomorrow’s payroll report.
If the market sells off sharply tomorrow, this trade will be profitable and in relation to the extent of that decline, of course. If, alternatively, the underlying contract explodes higher, we act on the premise that the long Aug put will go to zero, but this should be accompanied by similar losses in the deferred-month, even farther-out-of-the-money 2350 put for what should be a negligible loss.
Please contact your RJO representative for an updated bid/offer quote in the Aug Week-2 2450 / Sep 2350 Put Diagonal spread.
