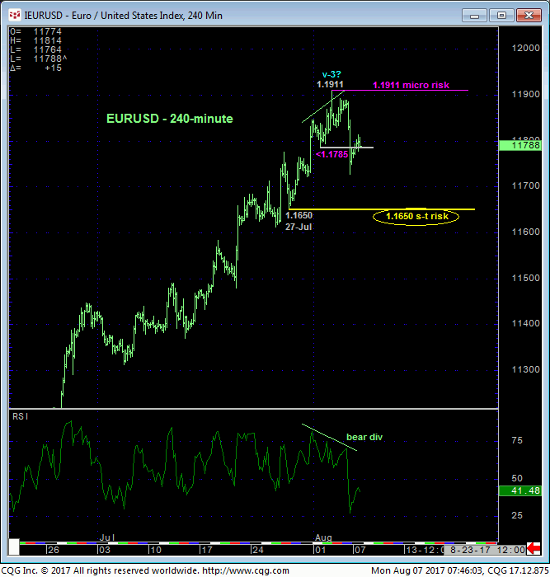
The market’s failure Fri below 01-Aug’s 1.1785 corrective low confirms a bearish divergence in momentum as detailed in the 240-min chart below. This mo failure defines 02-Aug’s 1.1911 high as one of developing importance and a micro risk parameter from which non-bullish decisions like long-covers and cautious bearish punts can now be objectively based and managed.

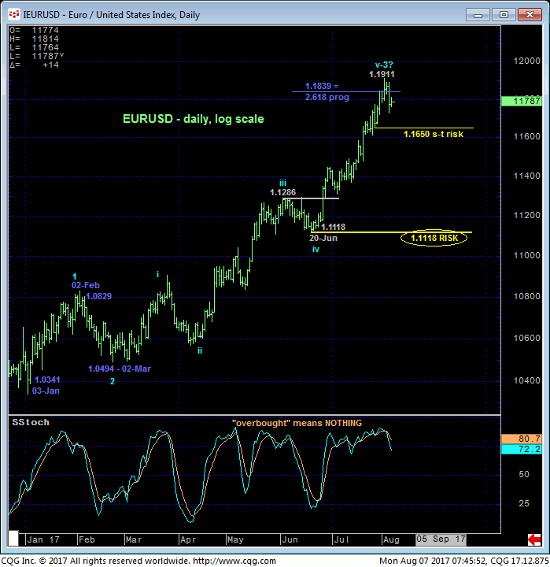
Panning out to a broader scale shown in the daily log scale chart below however, it is clear that Fri’s setback is grossly insufficient to conclude anything more than another corrective hiccup relative to the magnitude of the major uptrend. Against such a bullish backdrop, further weakness below 27-Jul’s 1.1650 corrective low and our short-term risk parameter remains minimally required to break at least the uptrend from 20-Jun’s 1.1118 low and possibly the suspected 3rd-Wave rally from 02-Mar’s 1.0494 low.

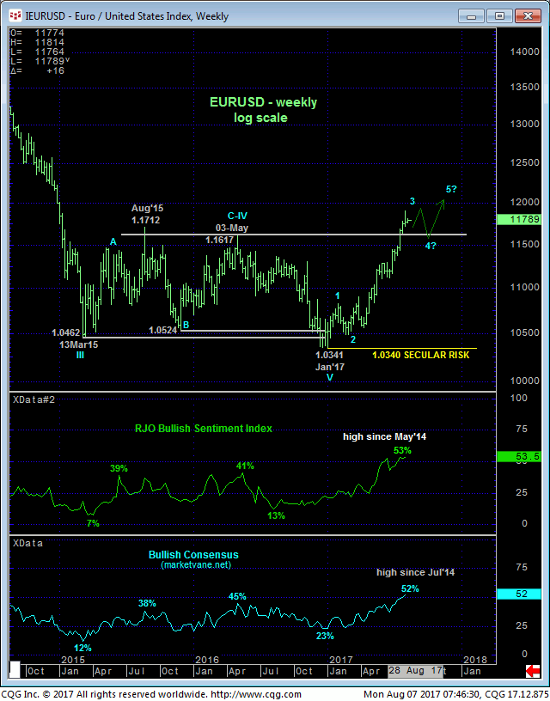
This said, the daily log scale chart above shows that this suspected 3rd-Wave from 02-Mar’s 1.0494 low has spanned a length just a tad beyond the 2.618 progression relationship of Jan-Feb’s initial 1st-Wave rally from 1.0341 to 1.0829. Furthermore, the weekly log chart below shows the not unexpected increase in bullish sentiment to its highest levels in three years.

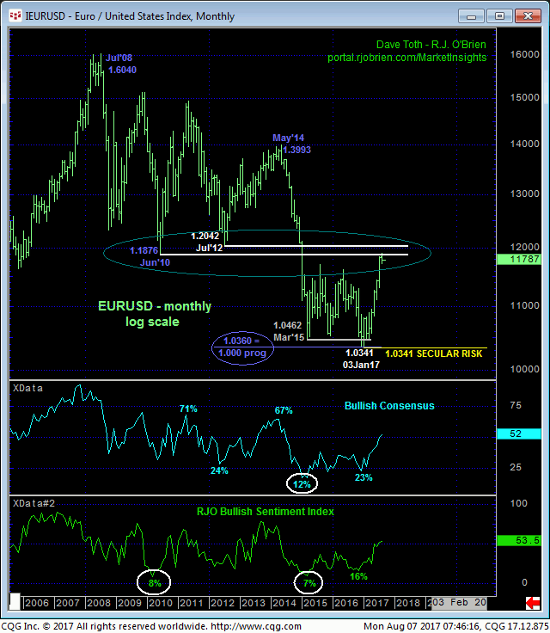
The monthly log scale chart below shows sentiment levels dramatically higher then those currently experienced, especially prior to the secular bear market that began in Jul 2008. But this monthly chart also shows the market’s return to the 1.19-/1.20-area that provided monumental support for 4-1/2-YEARS before Jan’15’s collapse below it that has left this area as a major resistance candidate ever since. We introduced a major base/reversal count in 31-Jan’s Technical Blog calling for a major correction within or reversal of the secular bear market from Jul’08’s 1.6040 high. If there’s a place for the Euro bull to run into some headwinds, we believe it will be around this 1.19-to-1.20-handle area where even a short-term momentum failure could morph into a more protracted move south.
CONCLUDING a more significant peak/reversal threat following such a micro mo failure like that discussed above is “mixing scales” and outside the bounds of technical disciple. But for those willing to exchange whipsaw risk for an early raffle ticket bet on such a peak, last week’s 1.1911 high serves as an excellent and objective risk parameter from which to do so. Again, more significant proof of weakness below at least 27-Jul’s 1.1650 low remains required to threaten the major uptrend enough to warrant more defensive action. And even then, the rejected high may have only completed the 3rd-Wave of an eventual 5-wave rally from Jan’s 1.0341 low that could drive prices in the 1.20-handle.
In sum, a bullish policy and exposure remain advised for shorter- and longer-term traders with a failure below 1.1650 required to pare of cover this exposure. Scalpers, however, are OK to take a punt from the bear side from 1.1840 OB with protective buy-stops just above 1.1911.

