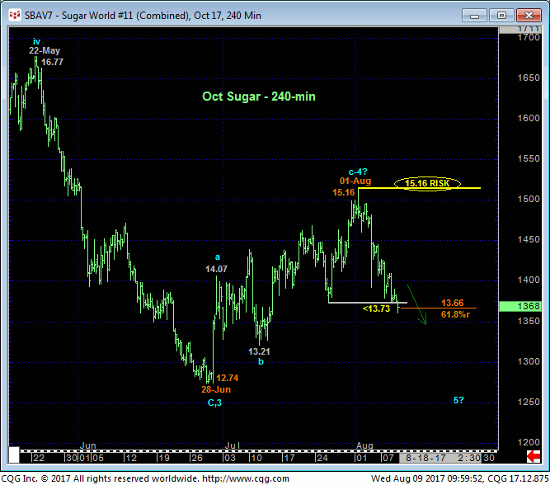
The market’s failure today below our 13.73 short-term risk parameter discussed in 27-Jul’s Technical Blog stems the recovery from 28-Jun’s 12.74 low and renders it a 3-wave affair as labeled in the 240-min chart below. Left unaltered by a recovery above 01-Aug’s 15.16 high, this 3-wave rebound is considered a corrective/consolidative structure that warns of a resumption of the past 11 months’ major bear trend to new lows below 12.74. In this regard 15.16 is considered our new key risk parameter from which non-bullish decisions like long-covers and resumed bearish punts can be objectively based and managed.
If we’re wrong on the resumed bear and Jul’s rally was actually the 1st-Wave of a major base/reversal process, we would expect a countering bullish divergence in momentum somewhere between spot (13.68) and 28-Jun’s 12.74 low. In lieu of such price action needed to identify a more reliable end to this month’s slide, further and possibly accelerated losses should not surprise.


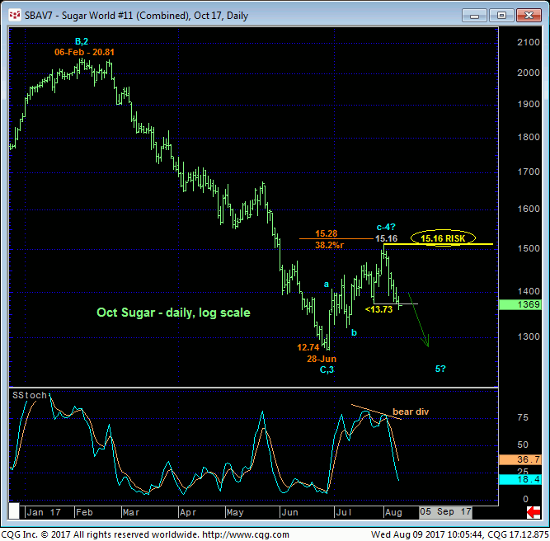
The daily log scale chart above shows the bearish divergence in momentum from a 15.16 high that failed to retrace even a Fibonacci minimum 38.2% of Feb-Jun’s 20.81 – 12.74 decline. Such a minimal recovery would seem to be consistent with a still-weak technical condition and an interim (4th-Wave) correction ahead of a (5th-Wave) resumption of the bear to at least one more round of new lows below 12.74. Strength above 15.16 specifically can now be required to not only negate this resumed bearish count, but also resurrect a base/reversal count that could be major in scope.
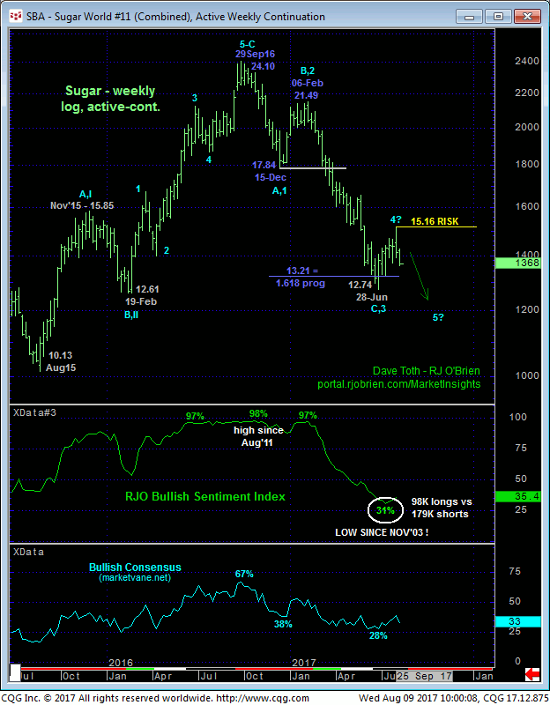
The weekly chart also shows historically bearish levels of market sentiment that we believe will contribute to a base/reversal “somewhere down here” that could be major in scope. But until the market recovers above 15.16, today’s confirmed shorter-term weakness tilts the longer-term directional scales lower and warns of a 5th-Wave run to new lows below 12.74.
In sum, all previously recommended bullish policy and exposure have been covered on today’s failure below 13.73 ahead of a suspected resumption of the major downtrend to new lows below 12.74. Strength above 15.16 is required to negate this call and resurrect a major base/reversal environment. This said, the market’s position in the middle of the past month’s 15.16 – 12.74-range presents a poor risk/reward condition from which to initiate directional exposure, so a neutral/sideline position is advised for the time being. We’ll try to discern a smaller-degree corrective high somewhere along the line that will identify a tighter but yet objective risk parameter from which a bearish position can be more effectively based and managed.


