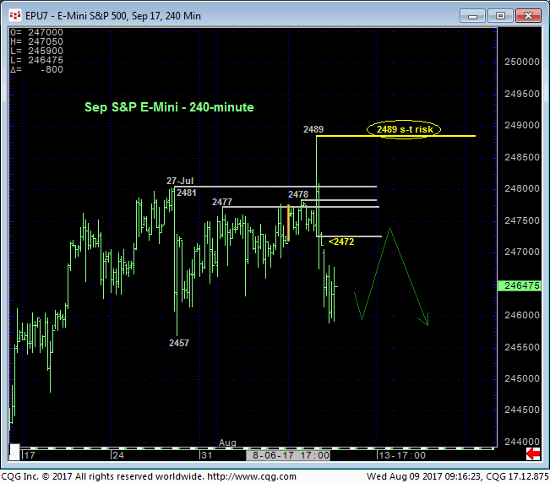
It only took the market four hours to fail miserably below our short-term risk parameter at 2472 and negate the resumed bullish call in yesterday’s Technical Blog resulting from the “breakout” above 2481 to another new all-time high. This whipsaw leaves yesterday’s 2489 high in its wake as the new short-term risk parameter the market now needs to recoup to resurrect the secular bull. In lieu of such 2489+ strength we anticipate further lateral-to-lower correction of the latest phase of the secular bull from 29-Jun’s 2402 low to that 2489 high.


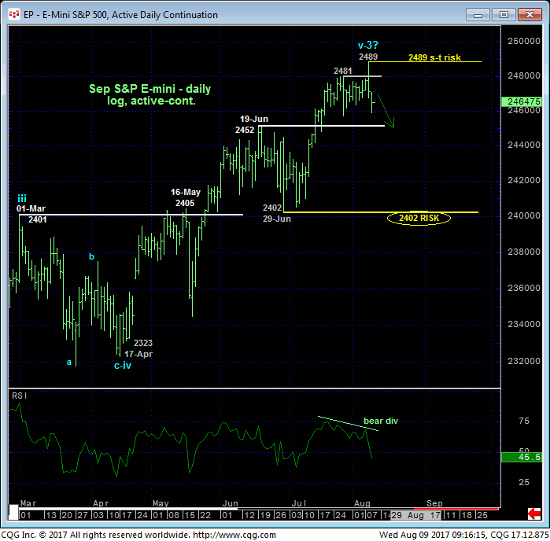
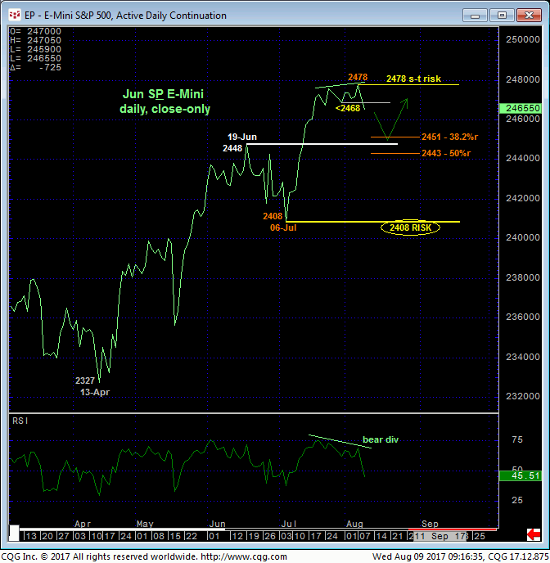
Both the daily bar chart above and daily log close-only chart below show the bearish divergence in momentum resulting from yesterday afternoon’s relapse. While there’s obviously some weakness and vulnerability exposed by this mo failure, it must be taken within the context of the longer-term advance. Indeed, this clear mo failure only allows us to conclude the end of the rally from 29-Jul’s 2402 next larger-degree corrective low (or from 06-Jul’s 2408 corrective low close), nothing more, nothing less.
The daily log close-only chart below shows that the (2451) 38.2% and (2443) 50% retraces of Jul-Aug’s 2408 – 2478 rally straddle 19-Jun’s former 2448-area resistance-turned-support. If there’s a “target” for an expected correction, we would say that this range is it and where we would expect a countering bullish divergence in short-term mo to stem the correction and re-expose the secular bull.
To threaten the secular bull, commensurately larger-degree weakness below AT LEAST that 06-Jul 2408 corrective low close and/or 29-Jun’s 2402 intra-day low remains required. The disparity between yesterday’s 2489 high and new short-term risk parameter and these longer-term risk levels at 2408/2402 again emphasizes the importance of technical and trading SCALE in effectively navigating the typical correction-vs-reversal dilemma. If you’re a shorter-term trader with a tighter risk profile, the market has provided the evidence to neutralize bullish exposure and even punt from the bear side as long as the market stays below 2489. By sharp contrast yesterday/today’s “failure” doesn’t even register on a longer-term basis that, again, requires proof of weakness below at least 2408 to threaten a more protracted correction or reversal lower that would warrant defensive action.

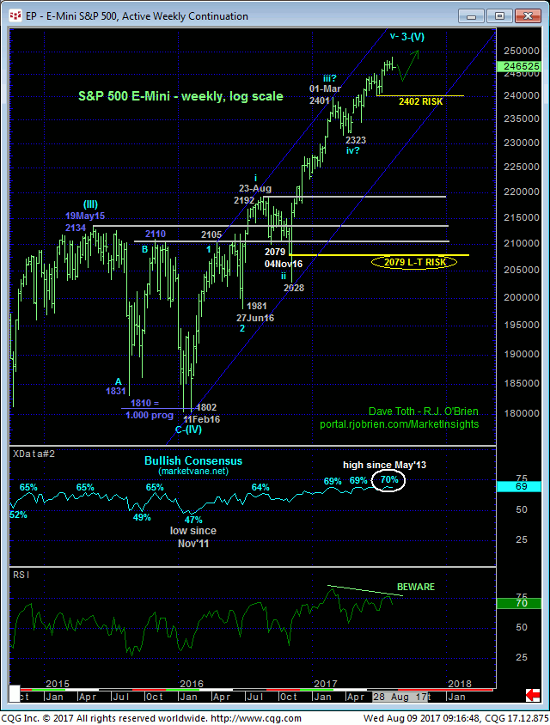
Only a glance at the weekly log chart below is needed to see that, MINIMALLY, a failure below 29-Jun’s 2402 corrective low is required to break the uptrend from even 17-Apr’s 23232 low, let alone one of the myriad larger-degree corrective lows this super-bull has left in its wake. These issues considered, shorter-term traders have been advised to step aside from bullish exposure on yesterday’s failure below 2472 and are OK to take a bearish punts from a suspected corrective rebound attempt to the 2475-area OB with a recovery above 2489 required to negate this call and reinstate the secular bull. Longer-term players are OK to pare bullish exposure to more conservative levels in exchange for whipsaw risk on a recovery above 2489 that would warrant reinstating that exposure. Ultimately however, a failure below 2408 remains required to threaten our long-term bullish count enough to warrant moving to the sidelines. We will be watchful for a bullish divergence in short-term momentum from the 2450-to-2443-area that we believe will raise the odds that our bull market correction count is correct ahead of a resumption of the secular bull and required resumed bullish position.


