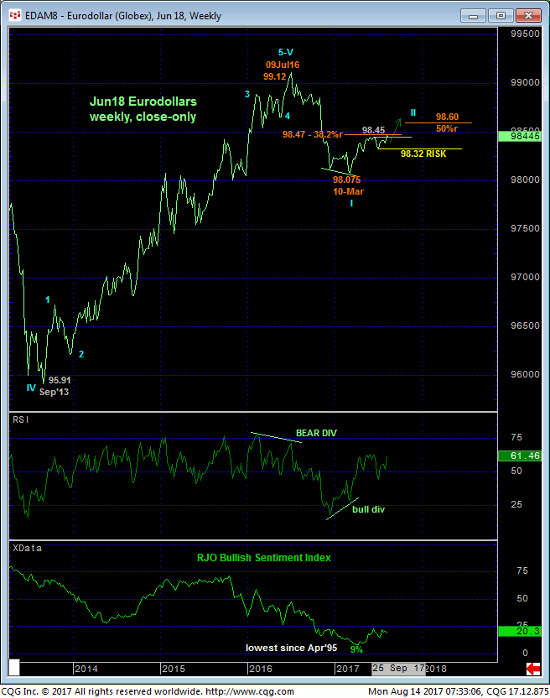
Fri’s clear break above the 98.42-area that has capped this market as resistance for the past three weeks confirms May-Jul’s sell-off attempt as a 3-wave and thus corrective affair that warns of a resumption of Mar-May’s uptrend that preceded it to new highs above 98.50. The important by-product of this breakout is the market’s definition of 04-Aug’s 98.375 low as the latest smaller-degree corrective low and our new short-term risk parameter the market is now minimally required to fail below to even defer, let alone threaten this call. Former 98.40-area resistance is considered new near-term support ahead of further and possibly steep gains.
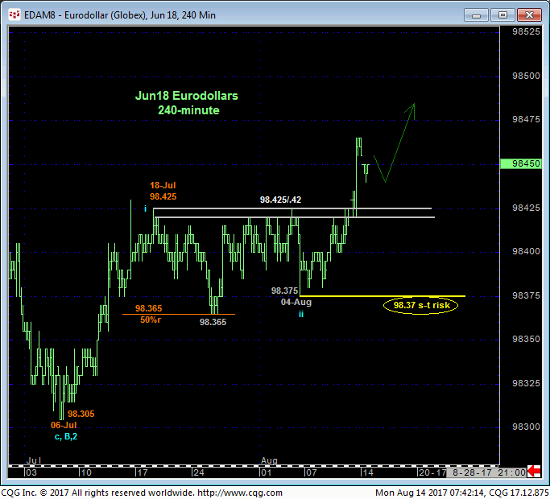
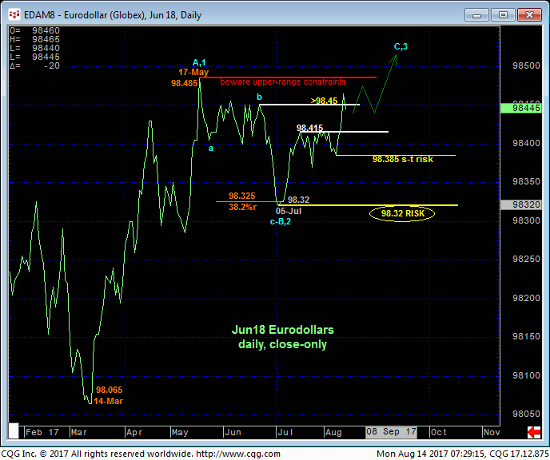
The longer-term magnitude of last week’s resumption of early-Jul’s recovery is more obvious in the daily close-only chart above that clearly renders May-Jul’s sell-off attempt from 98.485 to 98.32 a 3-wave structure as labeled. What’s also crustal clear as a result of last week’s resumed strength is the definition of corrective lows at 98.385 and especially 05-Jul’s 98.32 low that this market is required to fail below to threaten or negate a broader bullish count.
Granted, the market has yet to break this year’s pertinent highs and resistance between 98.485 and 98.515 that could easily prompt further lateral, consolidative behavior in the period ahead. But until or unless this market weakens below at least 98.37, at least the intermediate-term trend is up with a break above 98.50 more likely than a failure below 98.37.
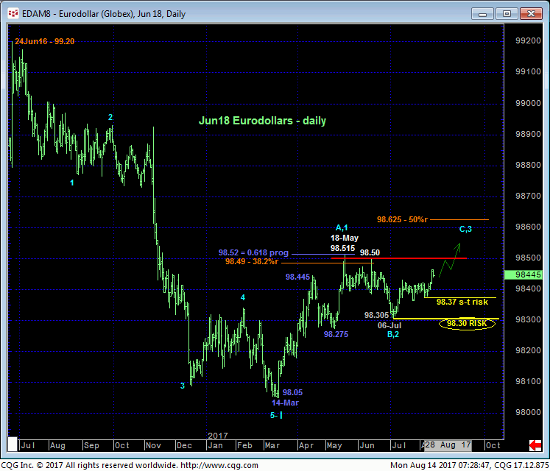
On an even broader scale Fri’s 98.465 close was a new weekly high close for 2017 and reinforces a broader bullish count that contends that this year’s recovery is a correction of Jul’16 – Mar’17’s 99.12 – 98.075 decline within a new secular bear market. And with (c-wave) “ends” of corrections often times characterized by sharp, emotional, headline-type move, traders are advised not to underestimate the extent of the current recovery from 06-Jul’s 98.305 low.
These issues considered, all previously recommended bearish exposure and policy has been nullified by Fri’s break above 98.43. Furthermore, traders are advised to move to a new bullish stance and approach setback attempts to 98.425 OB as corrective buying opportunities with a failure below 98.37 required to negate this specific call.
