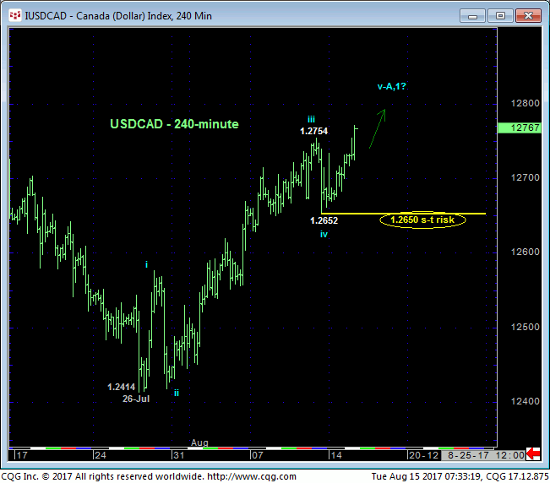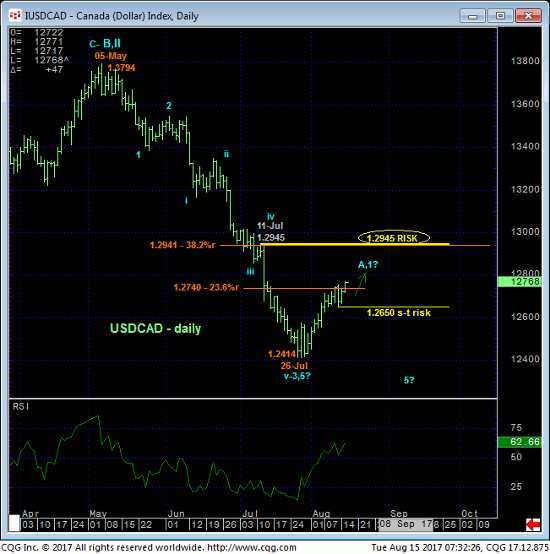
In 28-Jul’s Trading Strategies Blog we introduced the prospect for an interim corrective recovery and a favorable risk/reward opportunity from the bull side for shorter-term traders. Given the magnitude and impulsiveness of the collapse from May’s 1.3794 high however, we anticipated a relatively minor corrective hiccup to the 1.2650-area. More than two weeks on this recovery remains ongoing with this week’s rally above Fri’s 1.2754 high leaving Fri’s 1.2652 low in its wake as the latest smaller-degree corrective low and new short-term risk parameter from which traders can objectively rebase and manage the risk of recommended longs from 1.2475.
The impressive thing about this recovery is its trendy, impulsive nature. Indeed, with today’s break above Fri’s high a textbook 5-wave Elliott sequence is apparent in the 240-min chart below. The important aspect of this INITIAL 5-wave rally structure is that one of the basic Elliott Wave tenets is that corrections are not 5-wave patterns, they are comprised of only 3-waves. And while we’ve learned not to be held hostage by Elliott “theory”, what this infers is that either the past three weeks’ recovery is either only the (A-Wave) START of a much more extensive correction higher OR the initial 1st-Wave of an even more protracted reversal higher.
In either event, weakness below at least 1.2650 and our new short-term risk parameter is now required to arrest the clear and present intermediate-term uptrend and expose a correction of the rally from 26-Jul’s 1.2414 low.


The extent of May-Jul’s 1.3794 – 1.2414 decline is such that even the past three weeks’ impressive recovery falls well within the bounds of a mere bear market correction. HOWEVER, the combination of:
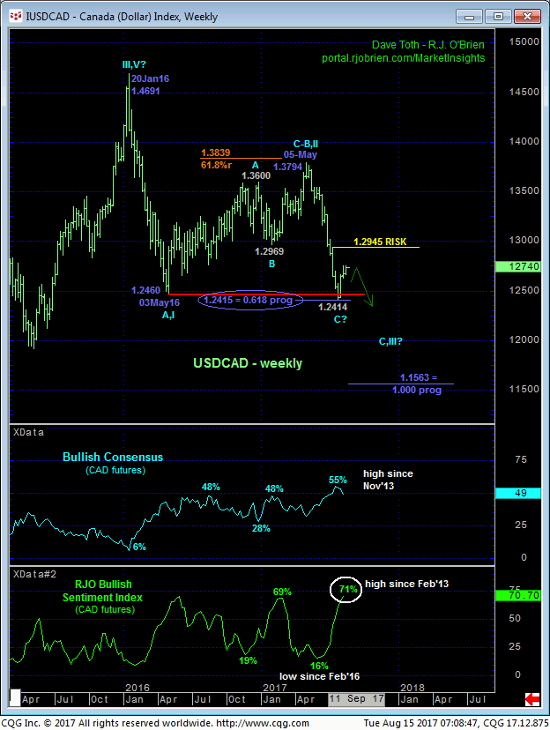
- market’s rejection of May’16’s 1.2460-area low/support
- Fibonacci fact that the decline from 05-May’s 1.3794 high was exactly 61.8% of the length (i.e. 0.618 prog) of Jan’May’16’s preceding 1.4691 – 1.2460 meltdown and, perhaps most importantly,
- return to a frothy 71% reading in our RJO Bullish Sentiment Index
is a powerful one that cannot be ignored as one that warns of a more significant base/reversal-threat environment.
It was the pitifully and stubbornly bearish view of the CAD futures by the Managed Money community back in May that warned us of a major recovery in the CAD and decline in the USD. Now, the exact opposite condition exists with the current 71% reading representing 80.5K Managed Money longs reportable to the CFTC versus just 33K shorts has this community historically long the CAD contract and short the USD at a time and technical condition when they apparently on the wrong side once again. This is the gist and another excellent example of contrary opinion theory and why it’s an integral part of our analysis.

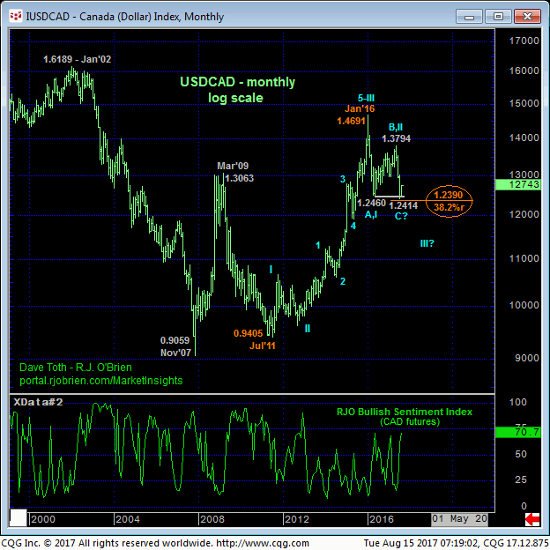
Given at least intermediate-term strength, it may also prove important that the 19-month sell-off attempt from Jan’16’s 1.4691 high has thus far come with a mere 24-pips of the (1.2390) 38.2% retrace of the entire secular bull from Jul’11’s 0.9405 low to Jan’16’s 1.4691 high on a monthly log scale basis below. It is also noteworthy that TO THIS POINT the decline from last year’s high is only a 3-wave affair as labeled. Left unaltered by a relapse below 1.2414 and against the backdrop of a still-arguable 6-YEAR uptrend, we cannot totally ignore the possibility of a resumption of the secular bull to new highs above 1.4691. Obviously however, MONTH’S of base/reversal behavior would be required before such a resumed bullish-USD call can even be remotely considered.
These issues considered, shorter-term traders remain advised to maintain longs from 1.2475 OB with protective sell-stops trailed to 1.2650. Longer-term players are advised top move to a neutral/sideline position to circumvent the heights unknown of a larger-degree correction or reversal higher. A near-term failure below 1.2650 is needed to stem the clear and present intermediate-term uptrend and expose a counter to the 3-week rally, but we will now approach such a setback to the 1.2550-area OB as a corrective buying opportunity. In lieu of such sub-1.2650 weakness further and possibly surprising gains are expected.


