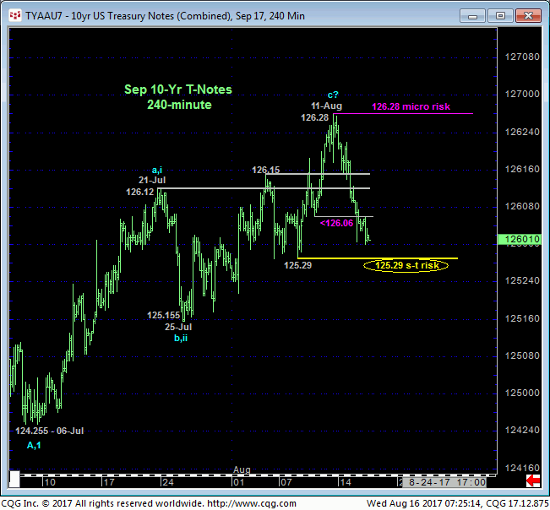
While the market has yet to fail below our short-term risk parameter defined by 08-Aug’s 125.29 corrective low in the Sep contract, this week’s rebound in actual 10-yr yields confirms a bullish divergence in short-term momentum that arguably contributes to a broader base/reversal count in rates and peak/reversal count in the contract. Furthermore, the relapse from Fri’s 126.28 high below 10-Aug’s 126.06 minor corrective low is enough to identify last week’s 126.28 high as one of developing importance and a more reliable level from which non-bullish decisions like long-covers and cautious bearish punts can be objectively based and managed.
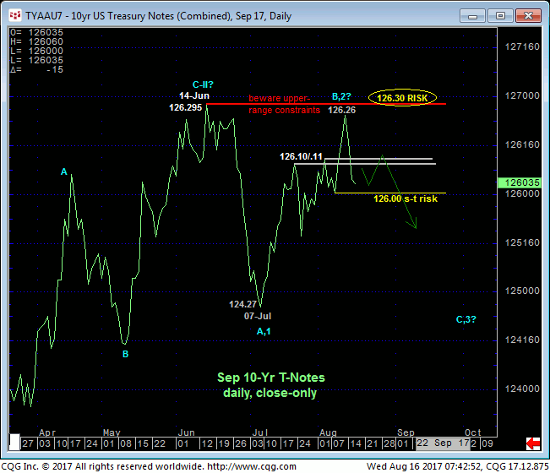
The market’s rejection thus far of the extreme upper recesses of the past couple months’ range is also considered a contributing factor to a peak/reversal-threat environment and really reinforces that entire upper-126-handle as a key resistance area the market needs to break to resurrect 2017’s broader recovery. In lieu of such and as we’ll discuss below, 14-Jun’s 126.295 high close maintains its standing as the end or upper boundary to a major bear market correction.
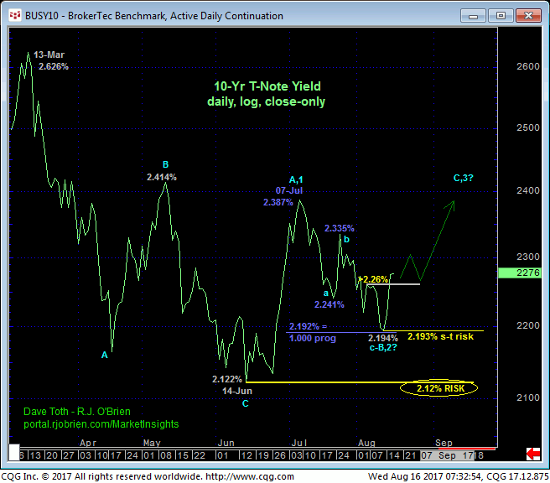
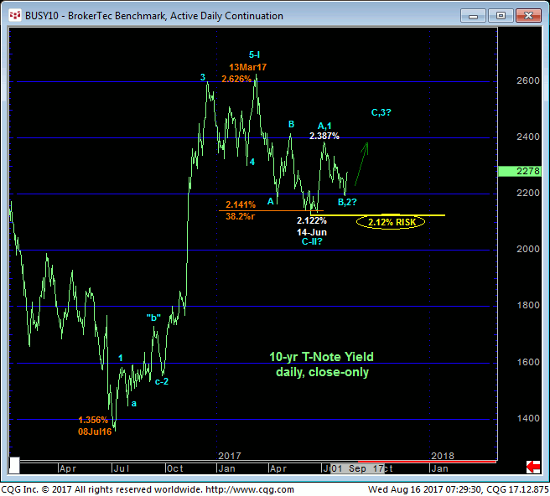
Yesterday’s close above 04-Aug’s 2.26% corrective high shown in the daily log close-only chart of 10-yr yields above is about as nondescript as it gets. Nonetheless, this rebound, in fact, breaks the recent slide in rates from at least 25-Jul’s 2.335% high. And the Fibonacci fact that the rate slide from that 2.335% high to Fri’s 2.194% low was equal in length (i.e. 1.000 progression) to the preceding decline from 07-Jul’s 2.387% high to 21-Jul’s 2.241% low contributes to a count that calls the entire Jul-Aug relapse attempt a 3-wave affair as labeled. Left unaltered by a relapse below Fri’s 2.193% low and new short-term risk parameter, this 3-wave setback is considered a corrective/consolidative structure that warns of a resumption of Jun-Jul’s rate rise that preceded it. This would mean a sharp, sustain rate hike to levels above at least 07-Jul’s 2.387% high straight away.
Against the backdrop of Mar-Jun’s 3-wave, 38.2% retrace of Jul’16 – Mar’17’s 1.356% – 2.626% hike, this week’s admitted minor rate rebound arguably contributes to a BASE/reversal threat in rates that could ultimately test the upper recesses of this year’s range and eventually resurrect what we still believe is a new secular move higher in rates that could span a generation. To threaten or negate this count all the 10-yr market has to do is relapse below 2.193% and 2.12%.
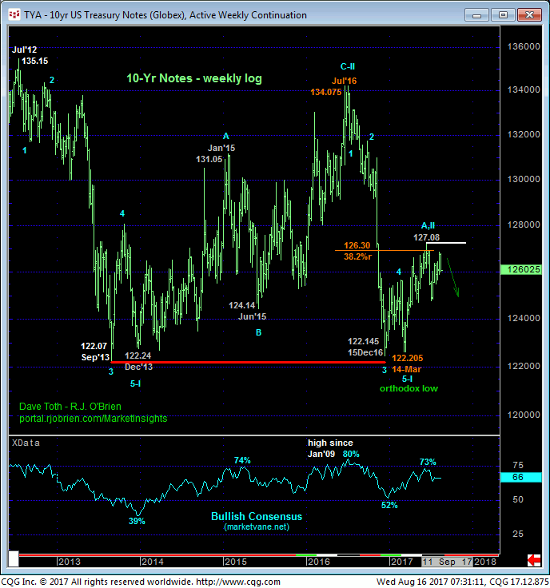
Finally, the weekly chart of the contract shows the recovery from Mar’s 122.20 low that, on the heels of 2016’s collapse, remains arguably corrective ahead of the eventual resumption of a major bear market in Treasuries. These issues considered, traders are advised to move to a cautious bearish policy and first approach rebound attempts to the 126.12-to-126-15-area as corrective selling opportunities with a recovery above 126.28 negating this specific call and warranting its cover. Further weakness below 125.29 will reinforce this call and expose further and potentially steep losses.
