SEP S&P EMINI
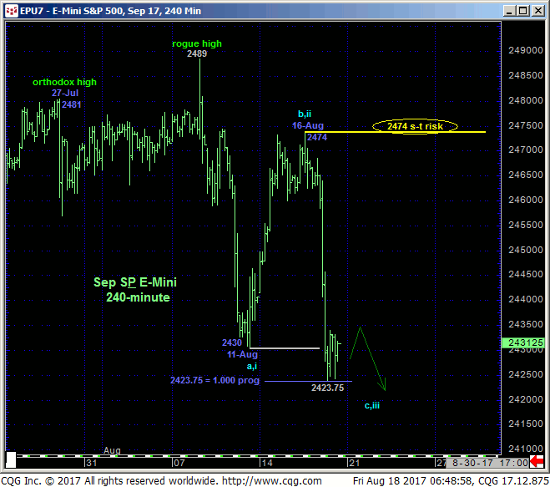
Yesterday’s relapse and break below last Fri’s 2430 initial counter-trend low reaffirms the developing correction and leaves Wed’s 2474 high in its wake as the latest smaller-degree corrective high the market is now required to sustain losses below to maintain a more immediate bearish count. Its failure to do so would render the selloff attempt from 27-Jul’s 2481 intra-day high a 3-wave and thus corrective affair consistent with our long-term bullish count. In this regard 2474 becomes our new short-term risk parameter to an interim bearish stance for shorter-term traders.
Approaching the past few weeks’ sell-off attempt as an interim correction within the secular uptrend, it’s notable that this week’s resumption of the slide from Wed’s 2474 high spanned an identical length (i.e. 1.000 progression) to the preceding break from 27-Jul’s 2481 high to 11-Aug’s 2430 low (NOTE: We’re ignoring 08-Aug’s spasm to 2489 as a rogue event with no technical relevance). But while interesting, this merely derived technical level is insufficient in and of itself until the market stems the clear and present intermediate-term downtrend with a confirmed bullish divergence in momentum needed to identify a more reliable low and support from which any non-bearish decisions like short-covers and cautious bullish punts can only then be objectively based and managed. Nonetheless, the area around yesterday’s 2424 low bears watching as a developing support candidate that could ultimately provide the latest corrective low and base from which the secular bull may resume.
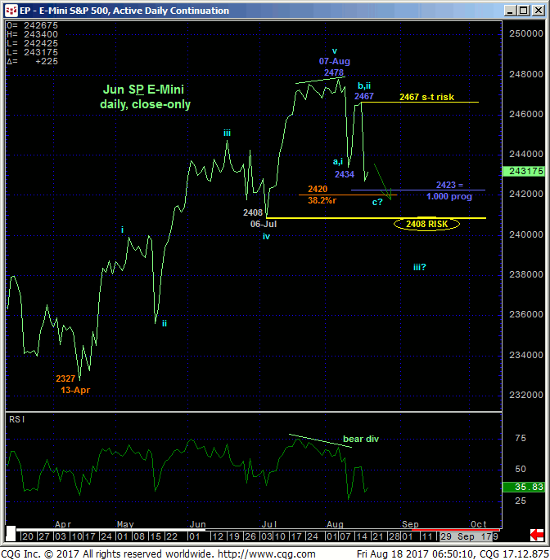
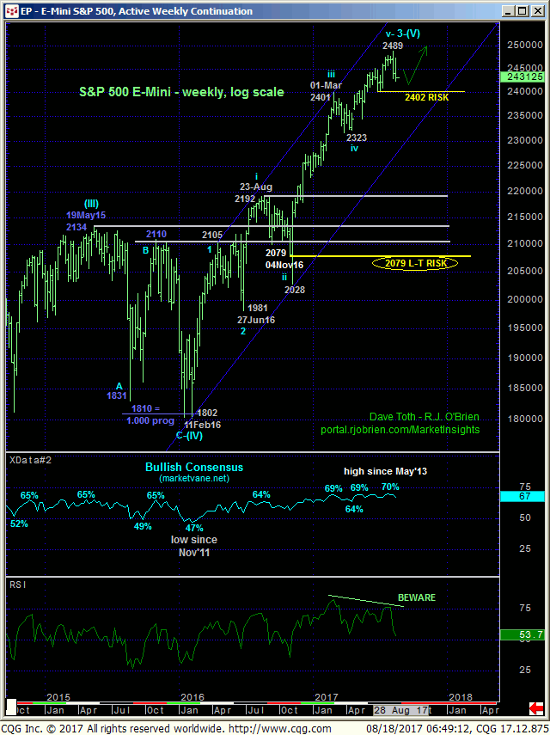
To threaten the secular advance on a major weekly log scale basis below, a failure below 29-Jun’s 2402 larger-degree corrective low and key long-term risk parameter remains minimally required. Basis the daily close-only chart above this key bull risk parameter is defined by 06-Jul’s 2408 corrective low close. Weakness shy of these levels is arguably only a correction of the 5-wave portion of the secular bull from 13-Apr’s 2327 low close to 07-Aug’s 2478 high where the Fibonacci minimum 38.2% retracement cuts across at 2420. Interestingly, the 1.000 progression of early-Aug’s 2478 – 2434 initial (suspected a-Wave) break from Wed’s 2467 corrective high cuts across at a neighboring 2423. If this month’s entire setback is another broader bull market correction, this 2423-to-2420-area is one around which to beware the requisite bullish divergence in shorter-term momentum needed to stem the slide and tilt the directional scales higher. In lieu of such a confirmed mo failure at least the intermediate-term trend is down and should not surprise by its continuance or acceleration, especially if the market break 06-Jul’s 2408 corrective low close.
In sum, a cautious bearish policy remains advised for shorter-term traders with a recovery currently above 2474 required to negate this call and resurrect the secular bull. We will be watchful for a bullish divergence in short-term mo that would tighten up that risk parameter. A bullish policy remains advised for long-term players with a failure below 2402 required to threaten this call enough to warrant a move to the sidelines.
SEP 10-Yr T-NOTES
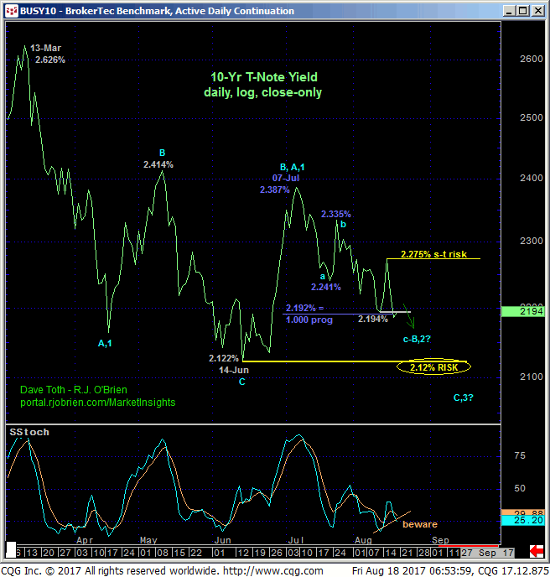
Reflecting resumed concerns about the equity market after yesterday’s S&P plunge, the daily log close-only chart of 10-yr yields below shows the market’s relapse below our short-term risk parameter at 2.194% that reaffirms at least the intermediate-term slide in rates and identifies Tue’s 2.275% high as the latest smaller-degree corrective high and new short-term risk parameter this market needs to recoup to resurrect a broader base/reversal count in rates.
14-Jun’s 2.122% low remains intact as a hugely important support condition and level this market needs to break to reinstate this year’s major reversal. In effect these 2.275% and 2.12% levels mark the key directional triggers heading forward. Flexibility to the inevitable breakout EITHER WAY is urged.
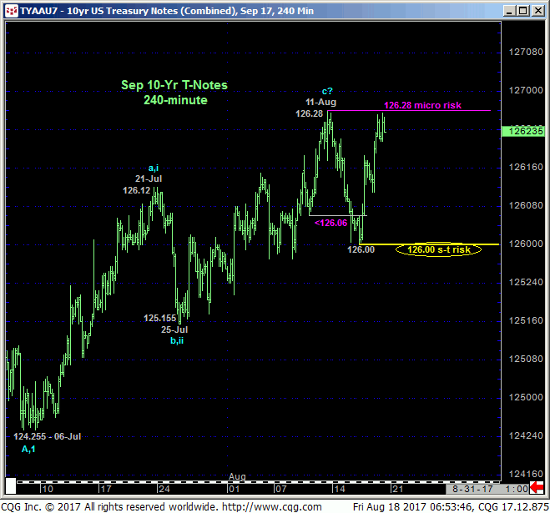
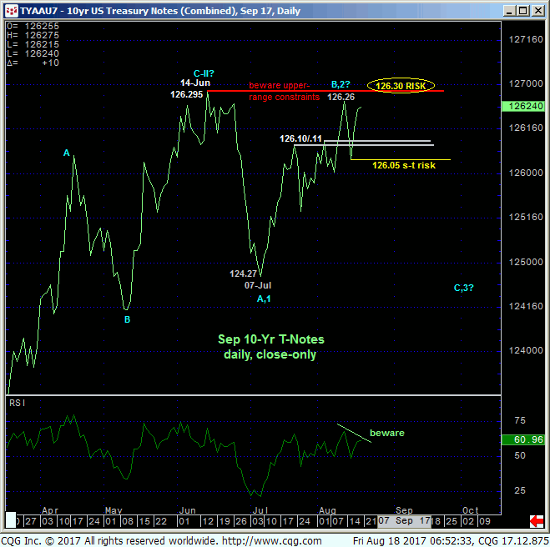
Basis the Sep contract shown in the 240-min chart above and daily close-only chart below, the extent of the past couple days’ rebound identifies Wed’s 126.00 low as the latest smaller-degree corrective low and new short-term risk parameter the market is required to fail below to reinforce a broader peak/reversal-threat environment. This risk parameter is crucially important given the market’s position at the extreme upper end of the past two months’ range shown below. If there’s a time and place for this market to fail miserably, we believe it is here and now. This said, a close above our key risk parameter at 126.30 that’s only a stone’s throw away would reinstate this year’s broader correction/reversal ahead of what could be steep gains thereafter.
In sum, we believe the market has identified 126.30 and 126.00 as the key directional triggers heading forward. For longer-term players a bearish policy remains OK until and unless the market closes above 126.30. Conversely, for shorter-term traders, a cautious bullish policy is OK until the market fails below 126.00.
