DEC GOLD
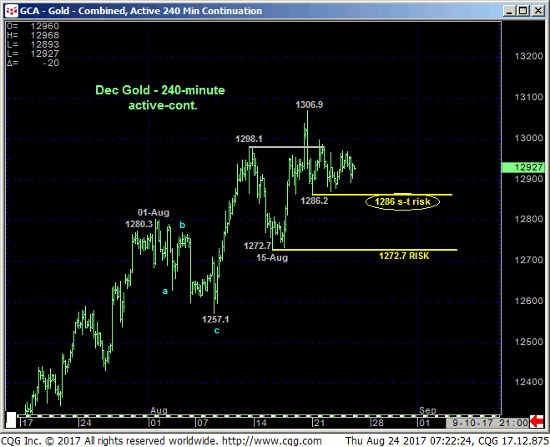
After posting a new high for this summer’s rally and the highest prices since last early-Nov, the 240-min chart below shows somewhat flagging price action. The 1286.2 level has supported the market since with the merely flagging price action (thus far at least) arguably corrective/consolidative ahead of a resumption of the uptrend. Should the market fail below Mon’s 1286.2 low however, at least the short-to-intermediate-term trend would be down. And with market sentiment back to relatively historically high levels, even such an admittedly minor degree mo failure could morph into a more surprising move south. Per such we are considering 1286 as our new short-term risk parameter from which shorter-term traders are advised to rebase and manage the risk of a still-advised bullish policy.
The threats to the bull are these:
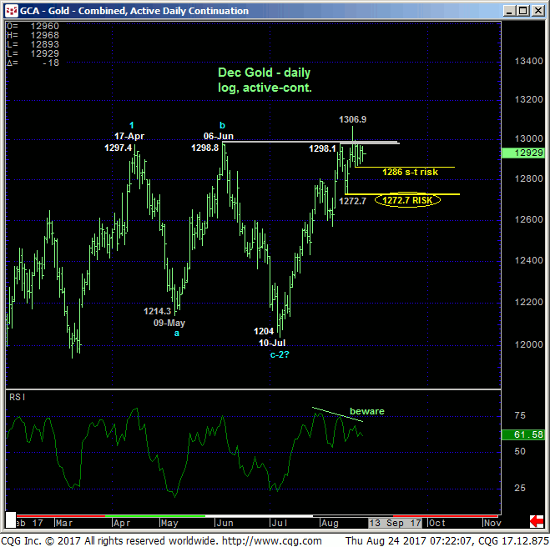
- waning upside momentum on a daily log scale above (confirmed below our long-term risk parameter at 1272.7)
- the market’s close proximity to the 1298-area upper boundary of the 4-month range and, most importantly,
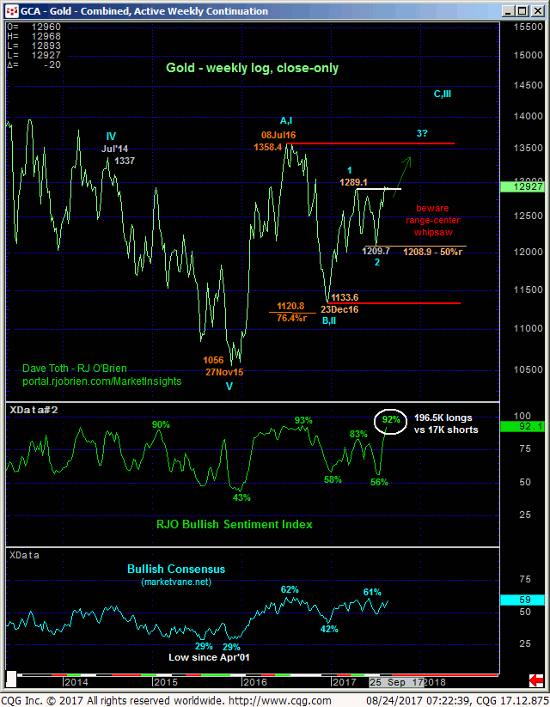
- the return to a historically frothy 92% reading in our RJO Bullish Sentiment Index.
Reflecting 196K long positions reportable to the CFTC versus just 17K shorts, the Managed Money community clearly has its neck sticking out on the bull side. Given the Jul-Aug rally, this is exactly what they (and most traders) should be: long and bullish. And such a bullish sentiment condition can sustain itself indefinitely as long as the uptrend remains intact. The moment that uptrend is compromised with a confirmed bearish divergence in momentum, even a short-term failure below a level like 1286, this historic long position warns of and contributes to a peak/reversal environment. The weekly log close-only chart below shows that virtually every major peak/reversal environment stemmed from this exact sentiment condition.
These issues considered, a bullish policy remains OK with a failure below 1286 threatening this call enough to warrant moving to a neutral-to-cautiously-bearish stance ahead of a correction or reversal lower that could surprise in scope. In lieu of such sub-1286 weakness the uptrend is considered intact and should not surprise by its continuance.
SEP SILVER
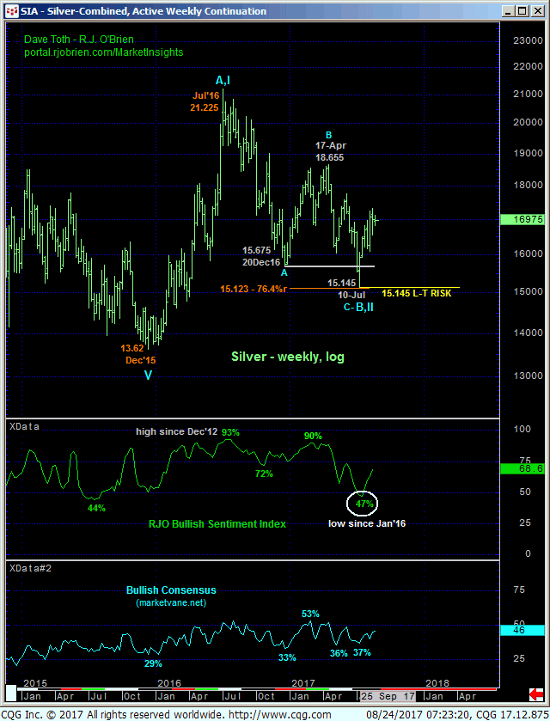
Unlike the gold market the Sep silver contract has failed below Mon’s 16.83 low that exposes at least the short-to-intermediate-term trend as down. The important by-product of this slip is the market’s definition of yesterday’s 17.105 high as the latest smaller-degree corrective high the market’s obligated to recoup to render the past week’s sell-off attempt from last Fri’s 17.32 high a 3-wave and thus corrective structure consistent with a still-developing broader bullish count. In this regard 17.105 is considered our new short-term risk parameter from which non-bullish decisions like long-covers and cautious bearish punts can be objectively based and managed.
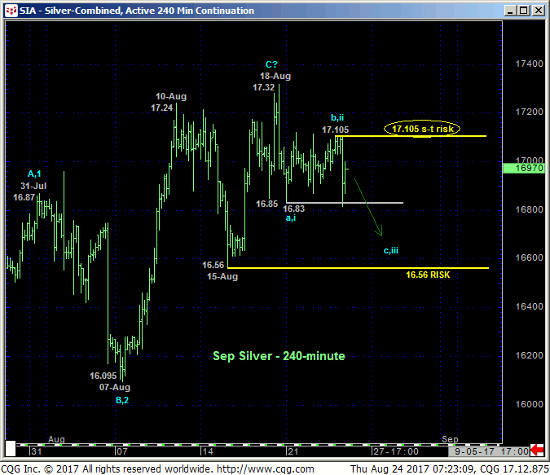
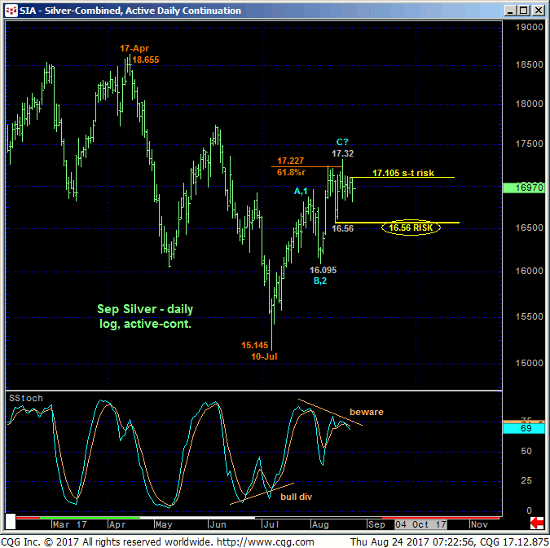
Contributing to at least an interim peak/correction threat is waning upside momentum on a daily log scale basis above (confirmed below our key long-term risk parameter at 16.56) and the market’s rejection thus far of the area around the (17.227) 61.8% retrace of Apr-Jul’s 18.655 – 15.145 decline.
Market sentiment is not as frothy as the gold market and we still believe the Jul’16-to-Jul’17 decline is a COMPLETE 3-wave correction within a major, multi-year BASE/reversal environment to eventual new highs above 21.225. But while this market sustains prices below our short-term risk parameter at 17.105, we believe it’s vulnerable to at least an intermediate-term correction. Subsequent weakness below 16.56 will expose a larger-degree correction or reversal lower.
These issues considered, shorter-term traders are advised to move to a neutral/sideline policy while longer-term players are advised to pare bullish exposure to more conservative levels and jettison the position altogether on a failure below 16.56. A recovery above 17.105 will resurrect a bullish count and warrant re-establishing bullish exposure.
