In now the eighth straight week of crude inventory draws, Wednesdays EIA Petroleum status report estimated stockpiles had declined by 3.3 million barrels. While a +3 million barrel draw is a significant consumption of oil, this week’s report is a less than half of last week’s 8.9 million barrel draw, and might be an early indication of tapered demand. Gasoline inventories also estimated a draw of 1.2 million barrels, which was an uptick for gas consumption when compared to last weeks no change. Crude being consumed by refiners to replenish the draws in gasoline stockpiles is to be expected, and watching production margins will be a key fundamental factor in coming weeks.
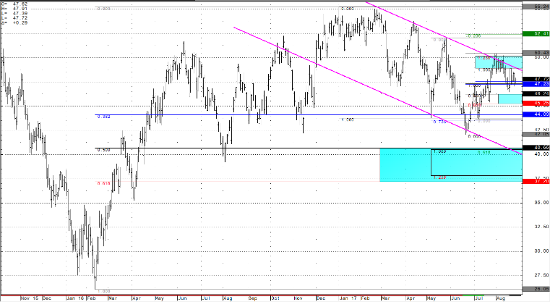
The same set of technical indicators that have been driving the market price over the last few weeks, including two Fibonacci measurements, the lows from July of last year, and the channel the market has been holding the last 4 months are still very much in play. The 44.00 support from equal legs and 50% fibs on the smaller timeframe charts, which I mentioned in last few week’s articles, is proving supportive and may be signaling the bulls are gaining back the ability to defend their ground on the larger time frame. However, now that front month crude prices have failed to break above the 50.00 handle, the bears have a line in the sand to defend, and a short term high that will keep the market suppressed. Last week’s rejection of the 50 handle, and the subsequent decline to test the lows of August (48.37 September contract) could be the key reversal and outside day the market is looking for to confirm a short term top (as was mentioned last week).
Resistance for this week is being tested into channel and Fibonacci confluence zone into the 49.00 to 50.00 handle. There is an equal legs measurement at 48.80 (which extends to the 123.6% line at 50.00), and this level aligns with channel trend line resistance. Support is likely to be found into the 50% Fibonacci retracement area from the lows of July to the highs of August, measured at 46.24. While WTI front month crude can remain solidly above 46.00 it’s likely that bulls will see this as an opportunity to defend the market from testing the summer time lows. In the medium to long term, WTI crude futures should find a support level where there is a confluence of Fibonacci support bands (retracements and extensions) between 40.65 and 37.20 (daily continuous chart below). Not much has changed in the last few weeks, and the broken record for WTI continues to spin… in my opinion, it is all the calm before a storm.
Crude Light Daily Continuous Chart


