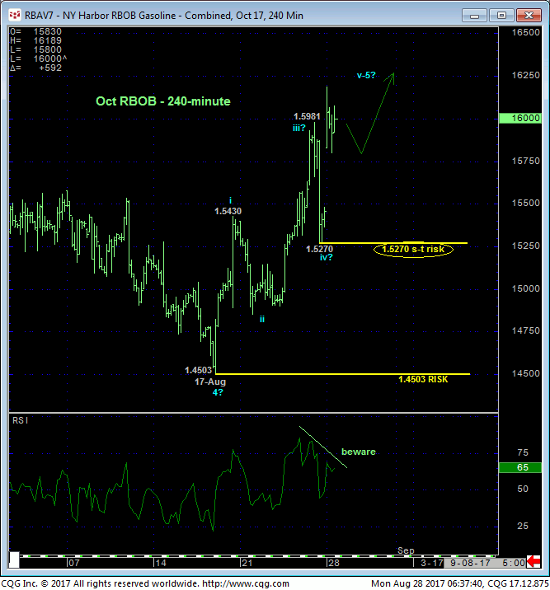
In an understandable jump in historical volatility due to Hurricane Harvey’s still-unknown impact, overnight’s continued rally above Fri’s 1.5981 high in the now-prompt Oct contract leaves Fri’s 1.5270 low in its wake as the latest smaller-degree corrective low the market now must sustain gains above to maintain a more immediate bullish count. In this regard 1.5270 is considered our new short-term risk parameter to a cautious bullish policy.
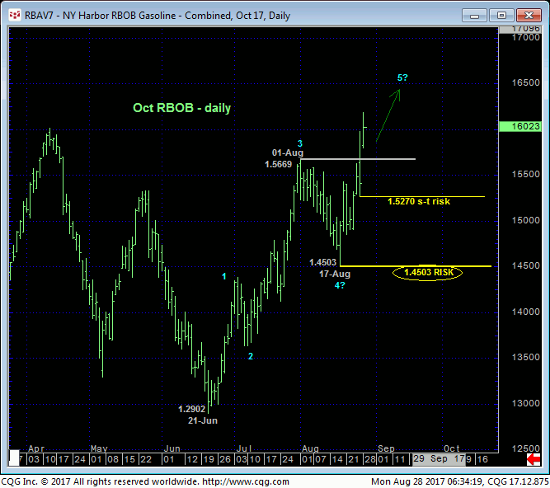
But while today’s gains reaffirm the developing uptrend from 21-Jun’s 1.2902 low on a daily basis above, the weekly chart of the Oct contract below shows the market engaging the upper-quarter of this year’s 1.6860 – 1.2902-range that presents a slippery slope for bulls. Hence the important of this relatively tight but objective short-term risk parameter at 1.5270. 17-Aug’s 1.4503 next larger-degree corrective low serves as our key risk parameter the market needs to fail below to, in fact, break the 2-month uptrend. While the market remains above 1.4503 and given the 3-wave and thus corrective-looking decline from Jan’s 1.6860 high to Jun’s 1.2902 low, a resumption of 2016’s major uptrend that preceded this year’s sell-off attempt should hardly come as a surprise; so making the market prove “non-strength” up here with a failure below at least 1.5270 is required before conceding to another intra-range corrective relapse.
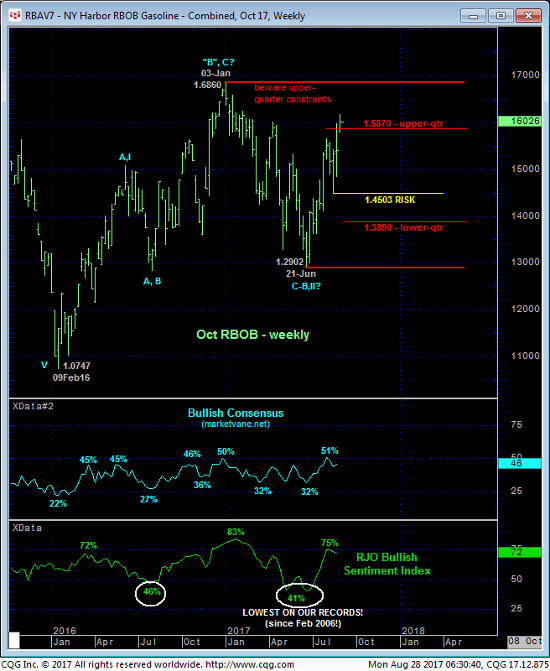
On an active-continuation chart basis however, weekly log scale chart below shows the market still deep within the middle-half bowels of this year’s 1.7750 – 1.3902-range where continued aimless, lateral whipsaw risk should also not come as a shocker. It is such lateral ranges and the challenges inherent to them that highlights the importance of identifying risk parameters to directional exposure and biasing to a more conservative approach to risk assumption.
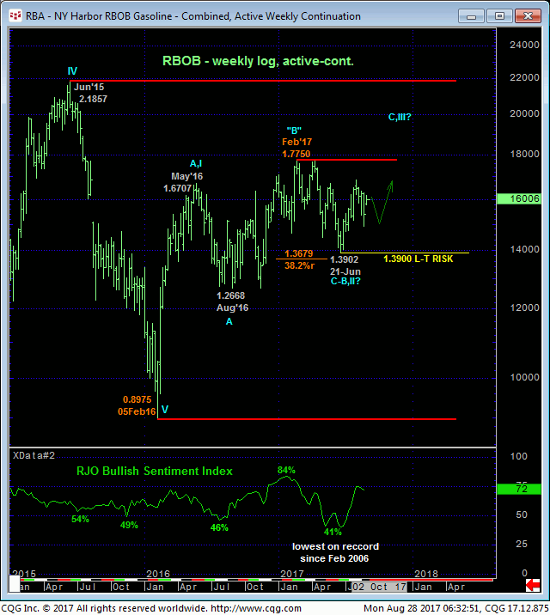
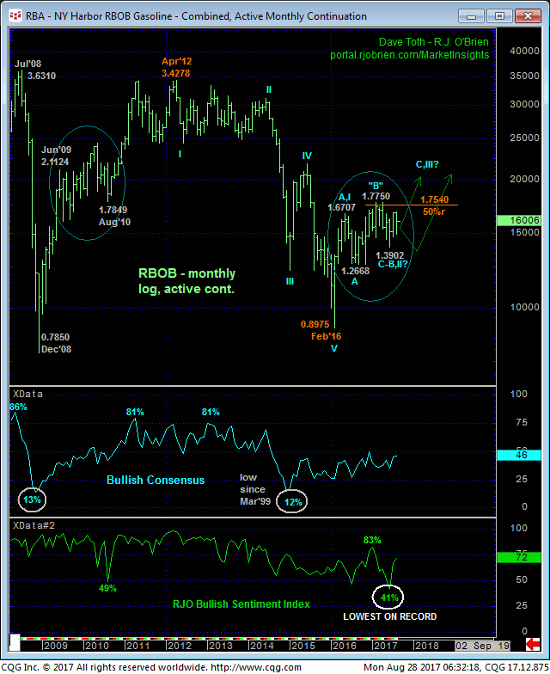
Finally, from a very long-term perspective shown in the monthly log scale active-continuation chart below, we’d like to remind traders of the major correction or reversal of the secular bear market from Apr’12’s 3.4278 high to Feb’16’s 0.8975 low following a bullish divergence in weekly momentum amidst historically bearish sentiment introduced in 26Feb16’s Technical Blog. While the debate may go on for weeks or even months yet as to where the market might be within the same type of base/reversal process that followed Dec’08’s low circled in blue below, such a process remains well intact with a minimum failure below Jun’s 1.3902 low required to even defer it, let alone threaten it. And until or unless such sub-1.3900 weakness is shown, an eventual bust-out above 1.7750 remains expected on this very long-term basis.
These issues considered, a cautious bullish policy remains advised with a failure below 1.5270 in the now-prompt Oct contract required to threaten this call enough to warrant a return to the sidelines ahead of a then-suspected reversion to the aimless lateral chop from the middle-half of this year’s range.