SEP 10-Yr T-NOTES
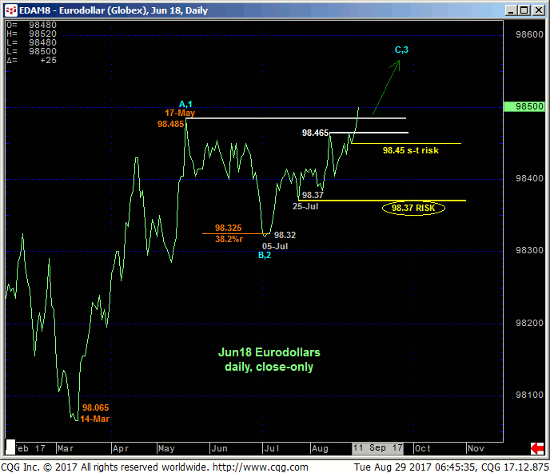
Overnight’s obliteration of the entire 126.30-area that has capped this market since early-Jun negates any and all previous bearish counts and resurrects what we believe is a major bear market correction from Mar’s 122.20 low. The 240-min chart below details not only higher prices, but ACCELERATED gains that should not surprise by their continuance and CONTINUED ACCELERATION.
Today’s rally leaves yesterday morning’s 126.26 low in its wake as the latest smaller-degree corrective low and new short-term risk parameter this market is now MINIMALLY required to fail below to even defer, let alone threaten a bullish count. Former 126.30-area resistance is considered new near-term support. But given the accelerated nature of overnight’s rally, we wonder if this market will even come close to that 126.30-area now.
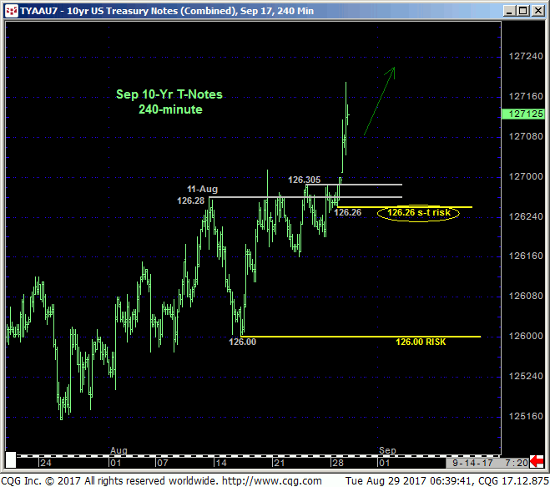
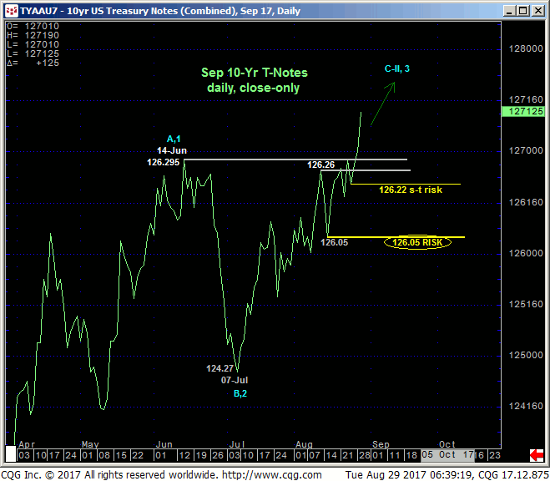
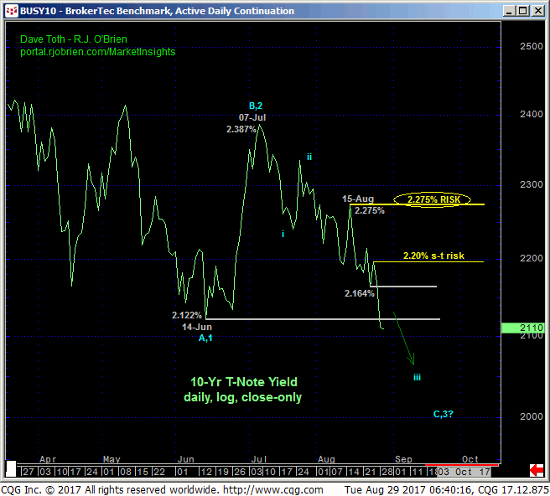
Only a glance at the daily close-only chart is needed to see that the trend is up on all scales, meaning that all pertinent technical levels ONLY exist BELOW the market in the forms of former resistance-turned-support like the 126.30-area and prior corrective lows like 126.26 and, on a commensurately broader scale, 15-Aug’s 126.05 larger-degree corrective low and key risk parameter. Basis 10-yr yields shown in the daily log close-only chart below, these analogous corrective highs and risk parameters cut across at 2.20% and 2.275%. The 2.12%-to-2.16%-area should provide new resistance.
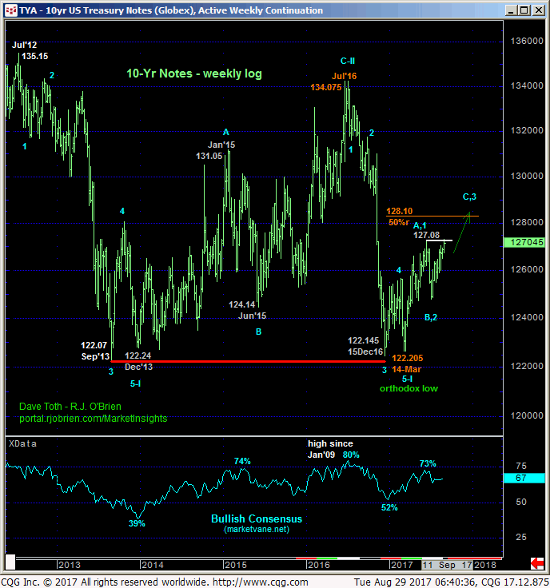
The weekly chart of the contract above shows this week’s resumption of this YEAR’S recovery that, again, we believe is just a correction of 2016’s decline within the context of a new secular bear market in t-note prices. Nonetheless, corrections can be extensive in terms of both price and time and traders are urged not to underestimate the extent of this year’s rebounbd.
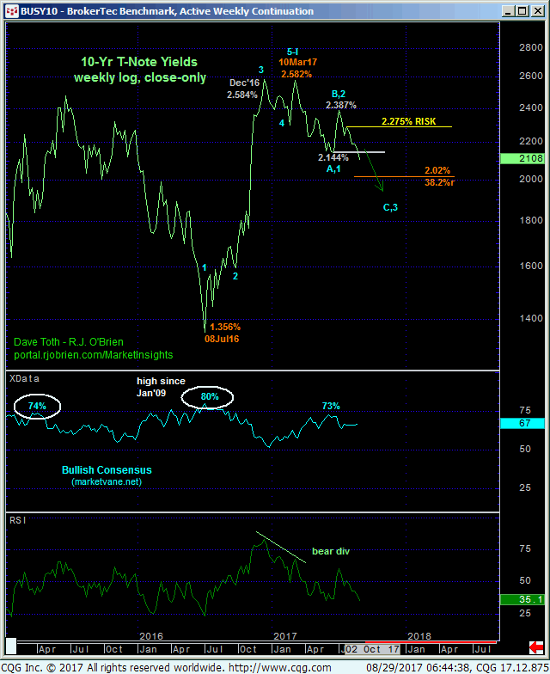
From a yield perspective on a weekly log close-only basis below, this year’s rate relapse has thus far failed to retrace even a Fibonacci minimum 38.2% of 2016-17’s 1.356%-to-2.582% rally, keeping this relapse well within the bounds of a mere correction within an even broader BASE/reversal environment from last year’s low. But again, as long as this market sustains rates below at least 2.20% and contract prices above 126.26, further and possibly steep contract prices are now exposed.
These issues considered, traders are advised to move to a new bullish policy and first approach setbacks to the 127.08-to-127.00-range as corrective buying opportunities with a failure below 126.26 required to negate this call and warrant its cover.
JUN18 EURODOLLARS
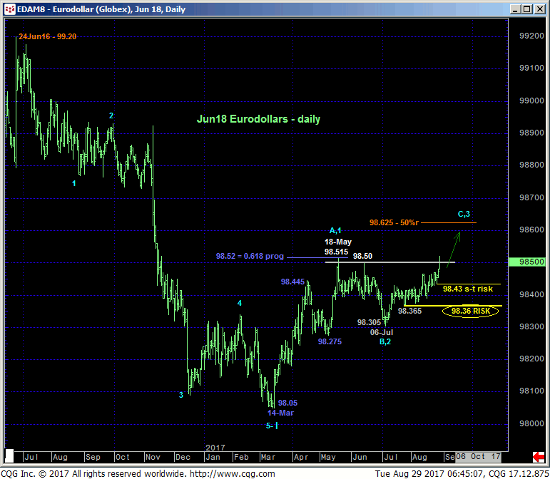
Today’s break above the past three months’ 98.50-area highs and resistance reaffirms our bullish count from 14-Aug’s Technical Blog and leaves Fri’s 98.435 low in its wake as the latest smaller-degree corrective low the market is now required minimally to failure below to even defer, let alone threaten a bullish count that could expose significant, even accelerated gains. In this regard 98.43 is considered our new short-term risk parameter to a still advised bullish count that calls for a continuation of a major correction of 2016-17’s entire 99.20 – 98.05 decline. Former 98.48-to-98.46-area resistance is expected to hold as new support.
In sum, a bullish policy and exposure remain advised with a failure below at least 98.43 required to threaten this call and further weakness below 98.36 required to negate it. In lieu of such weakness further and possibly accelerated gains are expected.
