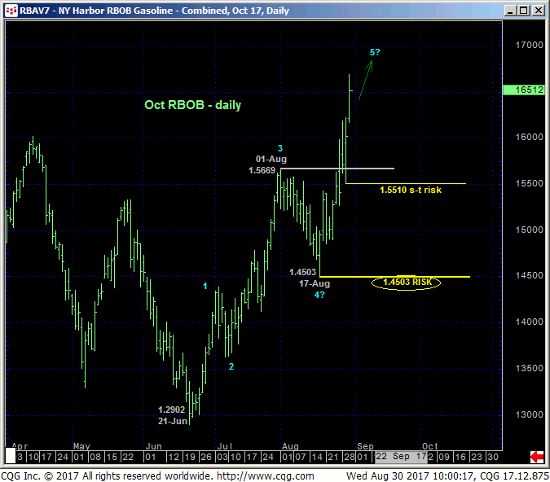
OCT RBOB
It’s no wonder why this uptrend has not only continued, but accelerated, with today’s latest spate of strength leaving yesterday’s 1.5510 low in its wake as the latest smaller-degree corrective low this market is now minimally required to fail below to threaten the advance. In this regard 1.5510 becomes our new short-term risk parameter from which a cautious bullish policy cane be objectively rebased and managed.
Taking SCALE into consideration, even a nominally steep 10-cent relapse will only allow us to conclude the end of the uptrend from 17-Aug’s 1.4503 larger-degree corrective low. And it’s that 1.4503 corrective low that remains intact as our long-term risk parameter the market is required to break to break the major uptrend from 21-Jun’s 1.2902 low. Former 1.5650-area resistance from early-Aug is considered new near-term support.
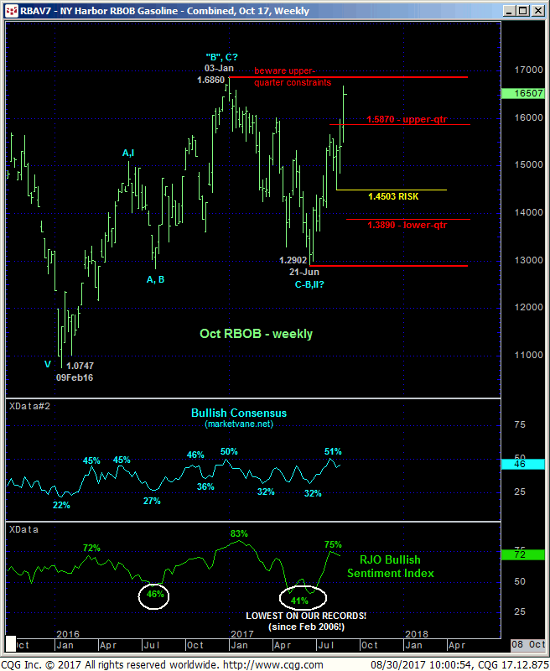
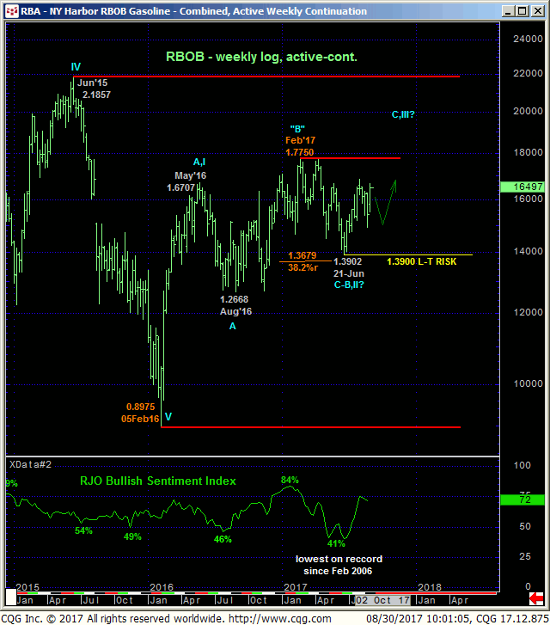
The threats to the bull are clear in the forms of the Oct contract’s proximity to the extreme upper recesses of this year’s range shown in the weekly chart above. If there’s a place and time to keep a keener eye on a momentum failure needed to stem the rally and expose another intra-range relapse, it is here and now. Additionally, on an active-continuation chart basis below, this weekly chart shows the market still deep within the middle-half bowels of this year’s range where the odds of aimless whipsaw risk are still approached as high. Nonetheless, the uptrend now spans over two months in length, is clear and present and should not surprise by its continuance.
These issues considered, a cautious bullish policy remains advised with a failure below 1.5510 required to threaten this call enough to warrant a move to the sidelines ahead of a correction or reversal lower of indeterminable scope. In lieu of such sub-1.5510 weakness further and possibly accelerated gains remain expected.
OCT HEATING OIL
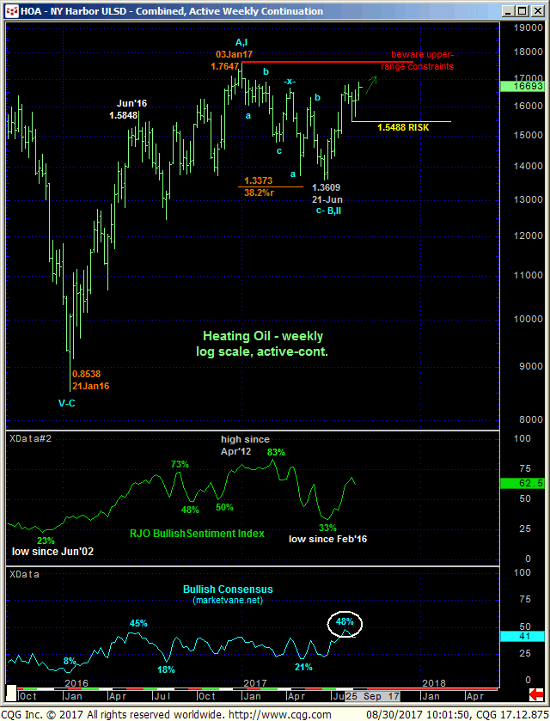
Similarly, today’s break above 10-Aug’s 1.6797 high confirms our bullish count discussed in 18-Aug’s Technical Webcast and leaves smaller- and larger-degree corrective lows in its wake at 1.6107 and 1.5488 that the market is required to sustain gains above to maintain a more immediate bullish count. In this regard these levels represent our new short- and longer-term risk parameters from which a bullish policy can be objectively rebased and managed.
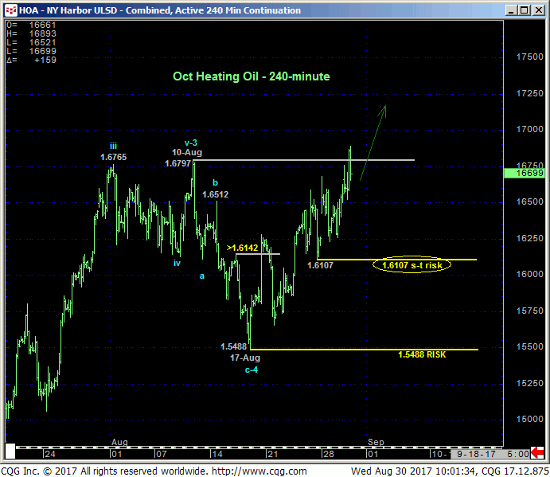
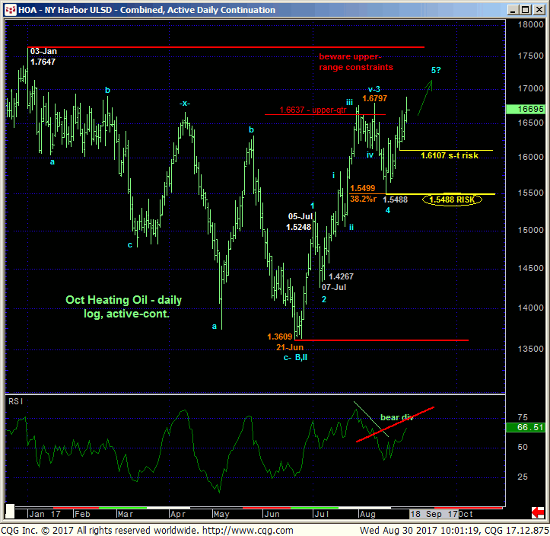
Today’s rally reinstates the major uptrend from 21-Jun’s 1.3609 low, but the market’s proximity to the extreme upper recesses of this year’s range and the prospect that the rally from 17-Aug’s 1.5488 low may be the completing 5th-Wave of an Elliott sequence from the Jun low are threats to the bull. Herein lies the importance of identifying corrective lows and risk parameters like 1.6107 and certainly 1.5488.
This said, long-term traders are also reminded of our very long-term bullish count that contends that 2016’s rally is only the INITIAL A- or 1st-Wave of a major, multi-year BASE/reversal count calling for eventual steep gains above 1.77 and that Jan-Jul’s labored, choppy sell-off attempt is characteristic of a corrective/consolidative event that is consistent with such a long-term bullish count. So the prospect of an accelerated breakout even from currently perceived lofty levels clearly cannot be ruled out.
In sum, a cautious bullish policy and exposure remain advised with a failure below 1.6107 threatening this call enough to warrant a return to a neutral/sideline position. In lieu of such weakness further and possibly accelerated gains remain expected.
