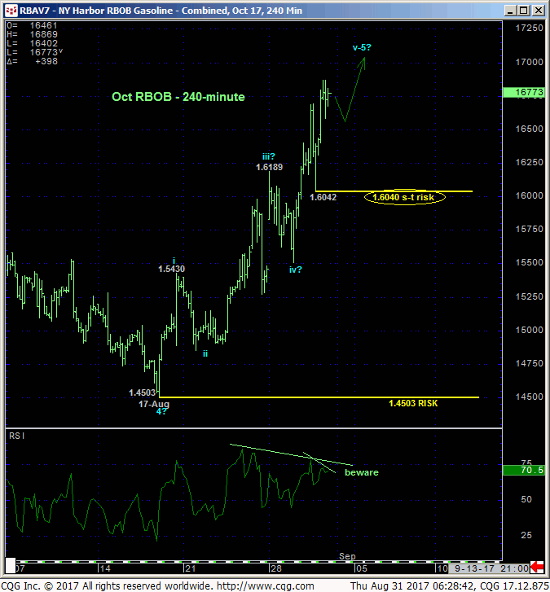
Especially with crude oil prices remaining lateral-to-lower within this year’s incessant range, keeping a tight, conservative leash on this clear and present but potentially temporary spike in Harvey-driven RBOB prices may come down to the technical and trading matter of SCALE. As a result of overnight’s continued gains the 240-min chart below shows that the market has identified yesterday afternoon’s 1.6042 low as the latest smaller-degree corrective low it now is required to sustain gains above to maintain a more immediate bullish count. Its failure to do so will confirm a bearish divergence in admittedly short-term momentum that will stem the rally and define a more reliable high from which non-bullish decisions like long-covers and cautious bearish punts can only then be objectively based and managed. In lieu of such sub-1.6040 weakness the uptrend remains clear and present and should not surprise by its continuance or acceleration.

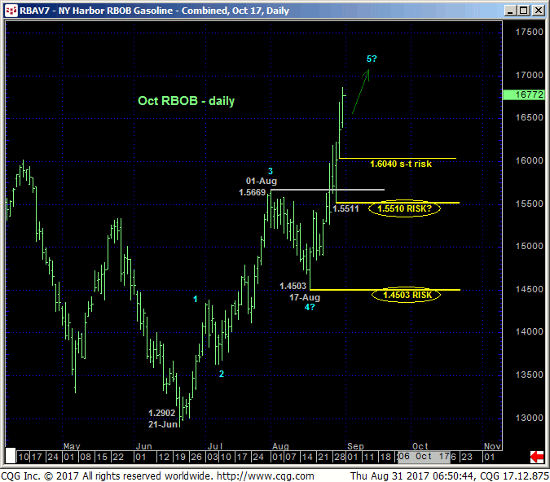
From a broader perspective a failure below 1.6040 will only allow us to conclude the end of the uptrend from 17-Aug’s next larger-degree corrective low at 1.4503, a low that remains as our long-term risk parameter the market is required to fail below to break the 2-MONTH uptrend from 21-Jun’s 1.2902 low. But while we cannot conclude the end of the 2-month bull from a short-term mo failure below 1.6040, the extent and uninterrupted nature of the past couple weeks’ rally left little in the way of other support candidates with the exception of the 1.55-handle area that was former resistance-turned-support.


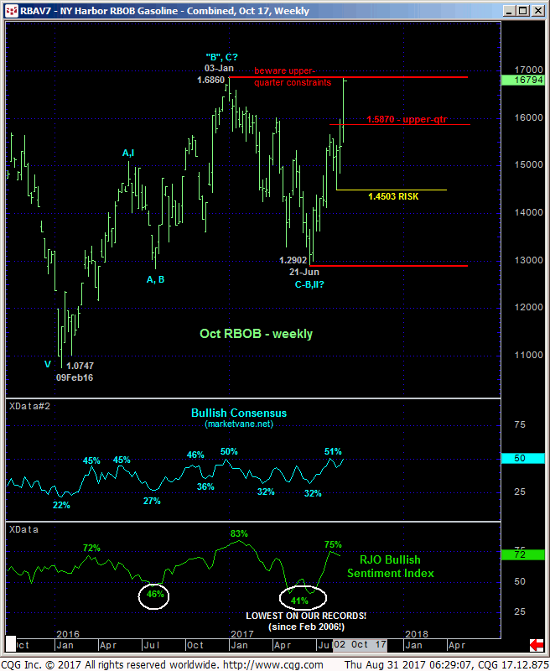
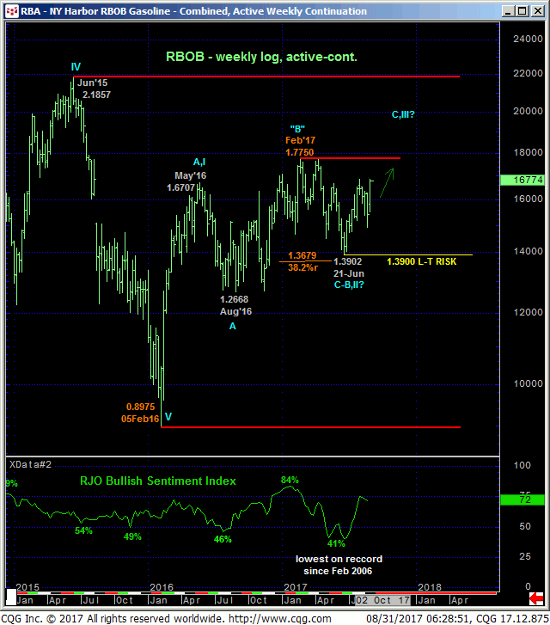
We have to be concerned about a potentially significant top and correction/reversal-threat due to the Oct contract’s engagement of its Jan high and major resistance at 1.6860 as well as the fact that, on an active-continuation chart basis below, the market remains marred within the middle-half bowels of the past 16-MONTH lateral range.
COULD this market be on the verge of an assault on the upper recesses of the past couple years’ range above Feb’s 1.7750 high in the then-prompt Apr17 contract? Sure (although languishing crude oil prices might suggest otherwise). But regardless of anything, until and unless this market fails below at least 1.6040 and preferably the 1.5500-area, the simple fact of the matter is that the trend is up and should not surprise by its continuance or acceleration. Per such, a cautious bullish policy remains advised with a failure below 1.6040 required to defer or threaten this call enough to warrant moving to a neutral/sideline position.


