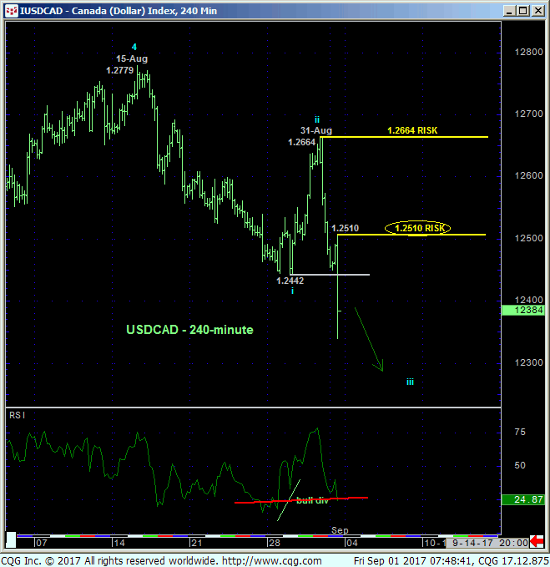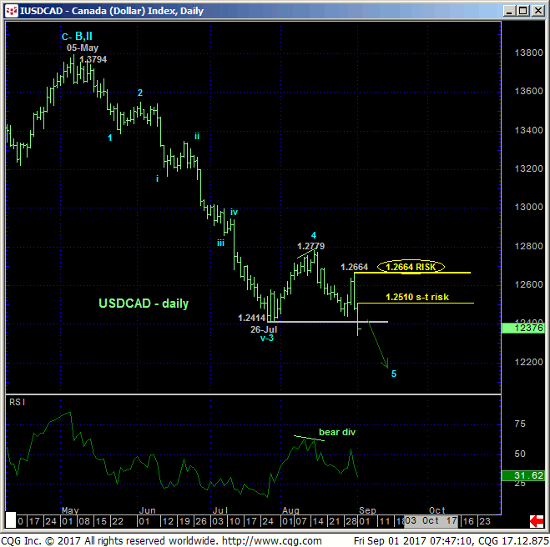
Today’s sharp relapse below our 1.2442 risk parameter AND 26-Jul’s 1.2414 low not only nullifies the recent bullish divergence in momentum and our interim base/reversal-threat count, but also reinstates and reaffirms the major bear market from Jan 2016’s 1.4691 high. The 240-min chart below shows that today’s break leaves today’s 1.2510 high and yesterday’s 1.2664 high as the latest smaller- and larger-degree corrective highs that now serve as our new short- and longer-term risk parameter from which a renewed bearish policy can be objectively based and managed.


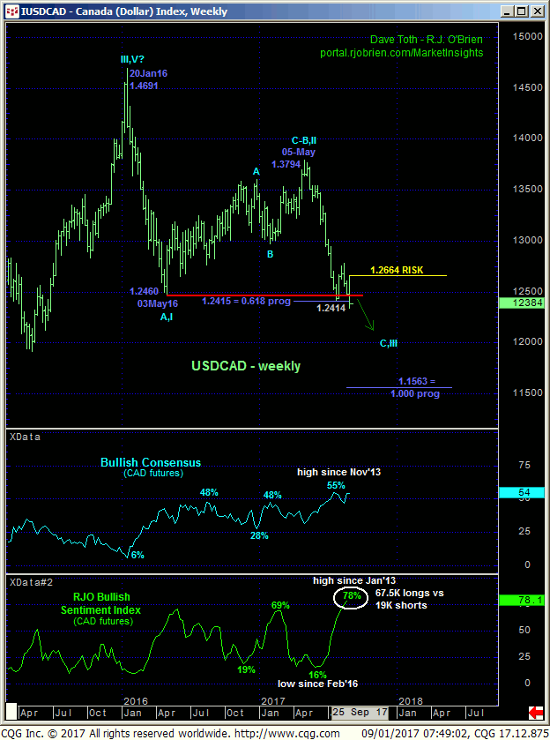
The weekly chart below shows that by breaking Jul’s 1.2414 low that market has not only reinstated the past 20-MONTH bear, it has exposed an area that is totally devoid of any technical levels of merit below it. In effect, there is no support. The ONLY levels of any technical pertinence currently are those ABOVE the market in the forms of former 1.2414-to-1.2442-area support-turned-resistance and the 1.2510 and 1.2664 corrective high and risk parameters. The only levels that can be identified below the market are “derived” levels like various “bands”, down-channel lines and moving averages and such, and we know that these never have nor ever will be helpful in identifying reliable support into a downtrend without an accompanying bullish divergence in mo, which requires a recovery above corrective highs like the ones cited above.

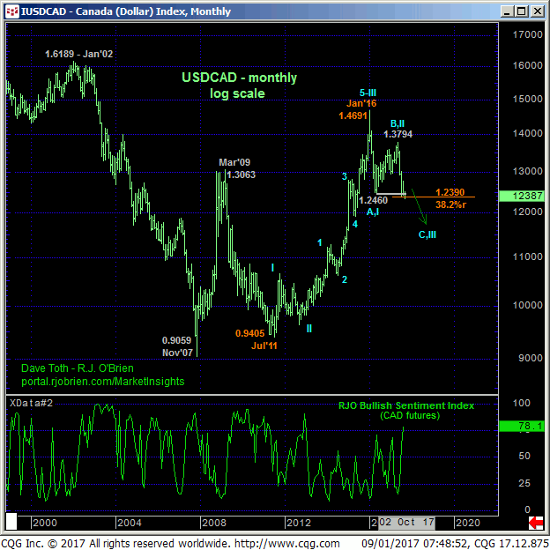
Finally, the monthly chart below shows today’s resumption of either a major correction or reversal of the secular bull from Jul’11’s 0.9405 low. In either event the market’s downside potentially could be severe. We have recently cited historically high levels of bullish sentiment accorded the CAD as a factor contributing to a BASE/reversal in the USD, but as the market has broken to new lows, market sentiment is not an applicable technical tool in the absence of a confirmed bullish divergence in mo needed to, in fact, break the clear and present downtrend.
These issues considered, traders are advised to return to a bearish policy and first approach recovery attempts to the 1.2400-area OB as corrective selling opportunities with strength minimally above 1.2510 required to threaten this call and warrant defensive measures. In lieu of such strength further and possibly steep losses are expected.


