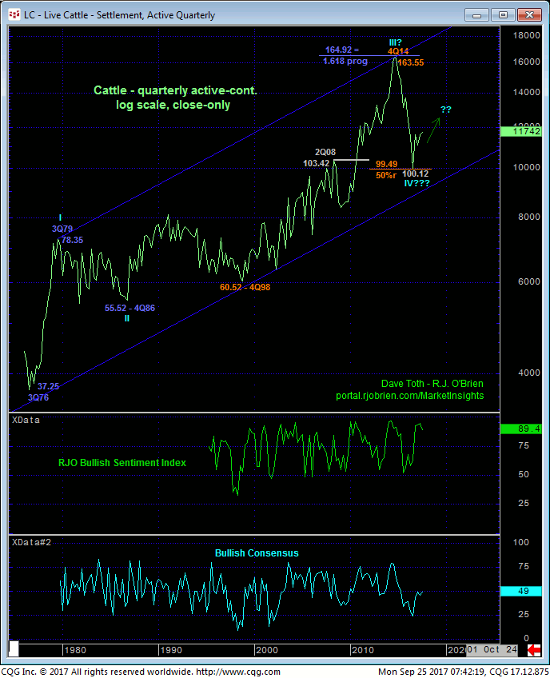
While the developing potential for a bearish divergence in momentum is clear in the hourly chart of the Dec contract below, the accelerated manner of last Wed’s portion of the rally reinforces a bullish count updated in 19-Sep’s Technical Blog. As a result of Fri’s continuation of the bull, the market has identified Thur’s 115.575 low as the latest smaller-degree corrective low the market must now sustain gains above to avoid CONFIRMING the bearish divergence in momentum to the point of non-bearish action like long-covers. In this regard 115.55 is considered our new short-term risk parameter from which bullish decisions can be objectively rebased and managed.
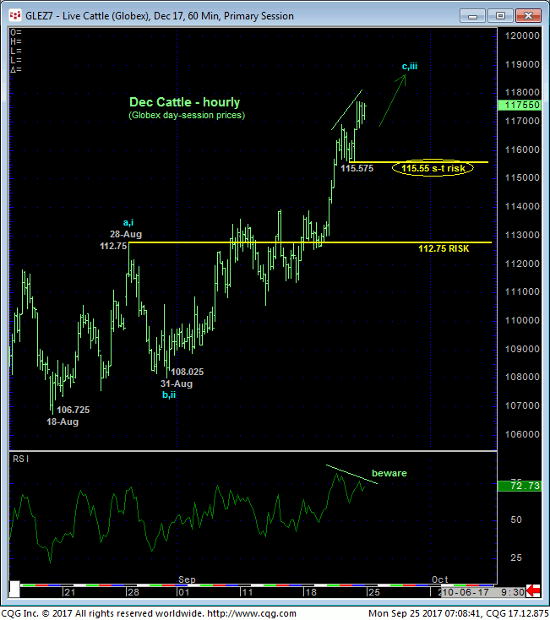
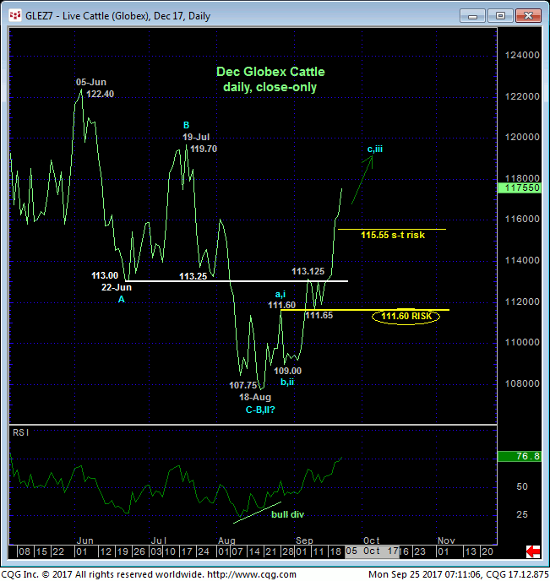
The daily close-only chart above and weekly log scale chart below show the Dec contract’s gross inability to sustain early-Aug’s breakdown below a lot of support from the 112-handle-area that then should have constrained this market as resistance if it was weak. It’s failure to do so renders the entire Jun-Aug decline a 3-wave and thus corrective affair that warns of a resumption of Oct’16 – Jun’17’s uptrend that preceded it. The Fibonacci fact that 18-Aug’s 106.725 low was just a few ticks removed from the (106.83) 50% retrace of the 2016-17 rally would seem to reinforce this bullish count.
We discussed a short-term risk parameter at 115.55 above, but to negate a bullish count on this longer-term scale we believe the market now has to fail below 28-Aug’s 112.75 (suspected 1st-Wave) intra-day high needed to jeopardize the impulsive integrity of a broader 5-wave Elliott sequence higher.
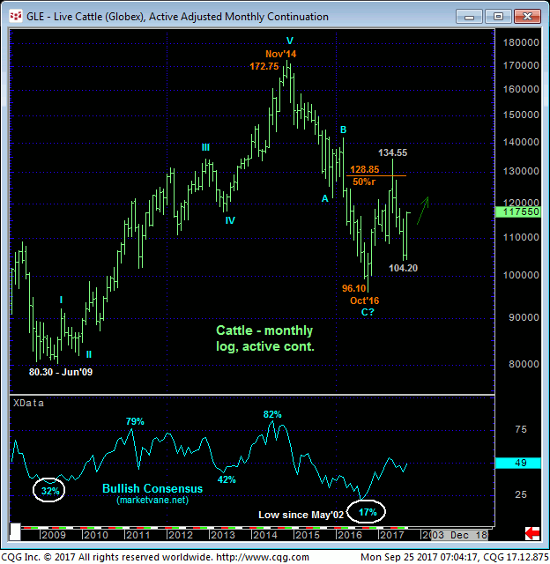
The stubbornly frothy 89% reading in our RJO Bullish Sentiment Index remains a technical fact that’s inconsistent with a broader bullish count, but traders are reminded that sentiment is not an applicable technical tool in the absence of a confirmed bearish divergence in momentum needed to stem the clear and present uptrend. Furthermore as we’ll show in the monthly chart below, the Bullish Consensus measure of market sentiment is only at a currently neutral 49% level that doesn’t infer a vulnerability to either direction.
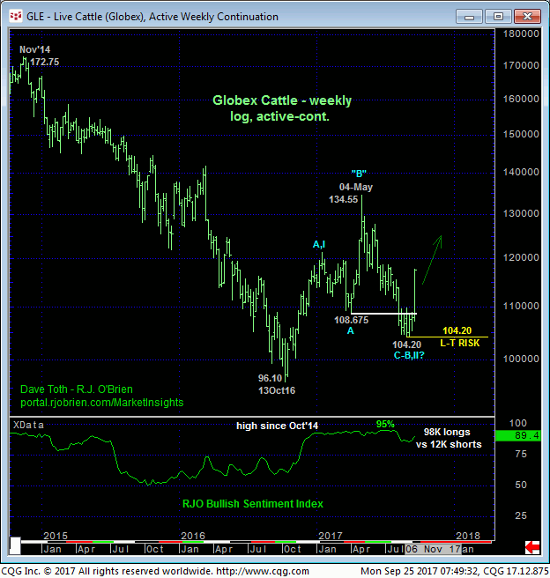
On an active-continuation chart basis shown in the weekly log chart above and monthly log chart below, the extent and impulsiveness of last week’s rally is particularly impressive following the market’s gross failure to sustain early-Aug’s break below Apr’s 108.675 low AND relative to Oct’16’s 96.10 low. The market obviously doesn’t like the lower-quarter of the past couple years’ range. This recovery contributes to either a larger-degree correction or reversal of the near-2-year bear market from Nov’14’s 172.75 high to Oct’16’s 96.10 low with a relapse now below a long-term risk parameter defined by late-Aug’s 104.20 low minimally required to negate a count calling for what could be surprising gains.
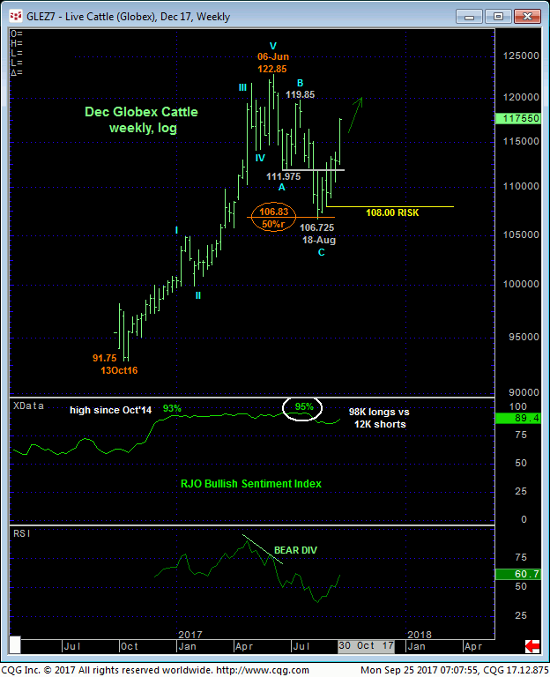
Lastly, revisiting a n even longer-term QUARTERLY log scale chart on a close-only basis below, this chart shows the past 40-year history of cattle prices and an up-channel that remains arguably intact. It’s almost eerie that a suspected 3rd-Wave rally from 4Q86’s 55.52 low spanned a length exactly 61.8% longer than the 3Q76-to-3Q79 rally from 37.25 to 78.35 AND that the relapse attempt from 4Q14’s 163.55 high quarterly close retraced exactly 50% pf the rally from 4Q98’s 60.52 low to that 163.55 all-time high. Could this mean a massive 4th-Wave correction is over and that the 40-year bull is poised to resume? Obviously we no one can conclude such after such a relatively minor recovery the past few weeks. But until or unless the market weakens below last month’s 104.20 low, this is a count that cannot be ruled out.
In sum, traders are advised to move to a more aggressive bullish policy and first approach setback attempts to suspected support from the 116.75-area as corrective buying opportunities with a failure below 115.55 required for shorter-term traders to step aside and subsequent weakness below 112.50 required for longer-term players to take similar defensive action. In lieu of such weakness further and possibly accelerated gains are expected.
