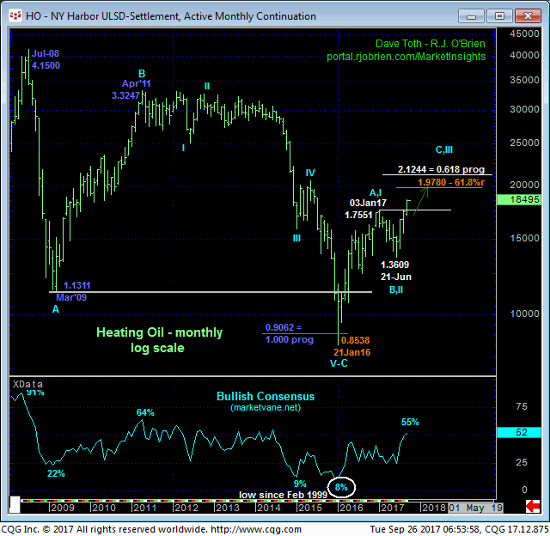
Whether many realize it or not, this month’s break above Jan’s 1.7551 high reinstates the uptrend from Jan’16’s 0.8538 low and reaches the highest prices since Jul’15 when the market was in the midst of a secular bear trend. This market not only has 19 MONTHS of basing behavior behind it, but by breaking out above Jan’17’s 1.7551 initial counter-trend high exposes a (C- or 3rd-Wave) rally that could produce steep, accelerated gains straight away in keeping with our major base/reversal count introduced in 04Mar16’s Technical Blog that identified the Jan’16 low at 0.8538 as the END of the secular bear market from Apr’11’s 3.3247 high.
Only a glance at the monthly log scale chart below is needed to see that there are NO levels of any technical merit above it that can be looked to as resistance. Virtually all levels of technical merit now only lie below the market in the form of former resistance-turned-support and prior corrective lows.


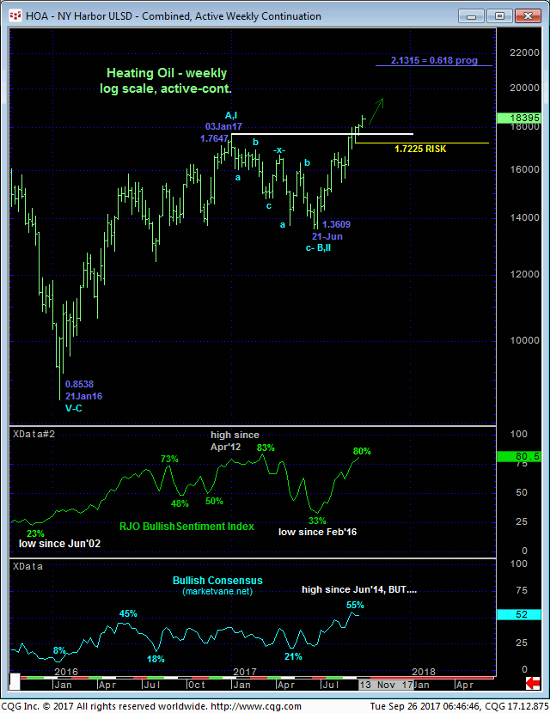
After months of agonizingly and frustratingly corrective downside chop from Jan’s 1.7647 high to 21-Juns 1.3609 low, the market finally recovered enough my mid-Jul to prepare for the possible resumption of 2016’s uptrend that preceded this price action as discussed in 14-Jul’s Technical Webcast. The first-half of Aug’s relapse attempt threatened this call only to have late-Aug’s recovery render that dip another correction ahead of a resumed uptrend that posted another new high today.
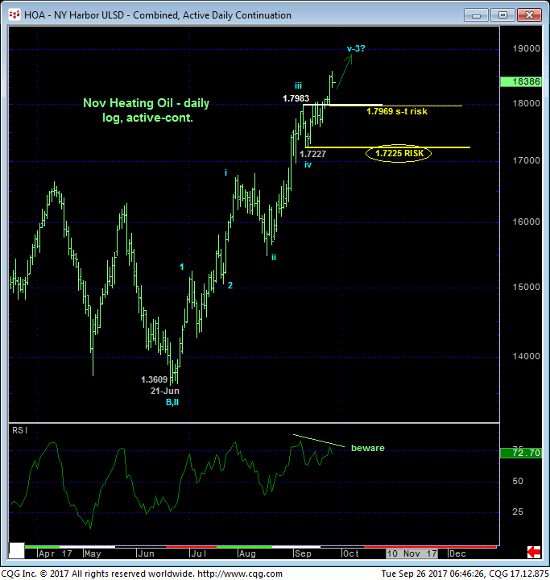
Yesterday’s sharp continuation of the uptrend left smaller- and larger-degree corrective lows in its wake at 1.7969 and 1.7225, respectively, that now serve as our new short- and longer-term risk parameters from which traders can effectively rebase and manage the risk of a still-advised bullish policy. The daily log scale chart below shows the developing POTENTIAL for a bearish divergence in momentum, but weakness below at least 1.969 is minimally required to even defer the bull, let alone threaten it. And clearly, a failure below 11-Sep’s 1.7227 larger-degree corrective low is minimally required to threaten the major uptrend.

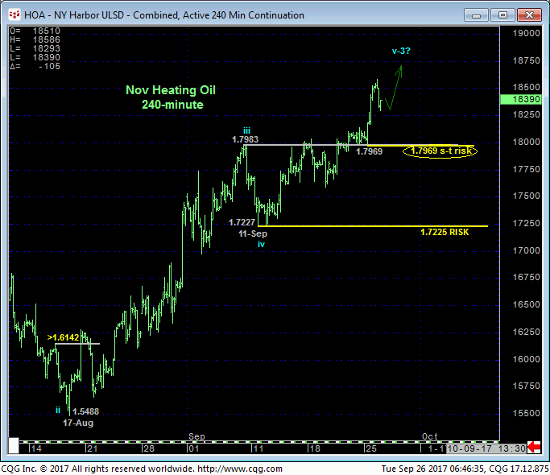
The 240-min chart below details the very orderly but impulsive uptrend and former 1.80-handle-area resistance that is now considered new near-term support ahead of further gains. These issues considered, a bullish policy remains advised with a failure below 1.7969 required for shorter-term traders with tighter risk profiles to move to the sidelines to circumvent the depths unknown of a correction or reversal lower. Longer-term players are OK to pare bullish exposure to more conservative levels on a failure below 1.7969, but commensurately larger-degree weakness below 1.7225 is required to break the bull and warrant their move to the sidelines. In lieu of such weakness further and possibly accelerated gains remain expected. The market’s upside potential should be considered indeterminable and potentially extreme (i.e. 2.00-to-2.50-range) as the market continues its reversal of a 5-year bear market from 3.3247 to 0.8538.


